Read summarized version with
Are you confident your content is being surfaced by AI assistants like ChatGPT and Google AI Overviews? As these platforms redefine search, traditional SEO is no longer enough. Brands now need a new discipline focused on Generative Engine Optimization, or GEO, to ensure visibility where answers are conversationally generated.
To navigate this shift, you need the right AI model optimization software. And to help you, we analyzed platforms that monitor your presence across major AI engines and ensure you remain visible to your audience no matter how they find information.
In this blog, we uncover the top-rated LLM optimization software for AI to help you choose the best one for your unique needs.
🕰️ TL;DR
|
Every Visitor Sees the Same Page. That's the Problem.
See where your site could personalize and test for different visitors, with a free analysis of your URL.

Why do businesses need LLM optimization software for AI?
Traditional SEO is no longer sufficient. Search is shifting from links on a page to answers in a chatbox. Take this example. A local bakery, 'The Urban Oven,' ranks #1 on Google for 'best sourdough in Brooklyn.' However, when people ask Perplexity AI 'where to find authentic sourdough bread in Brooklyn,' the AI recommends two other bakeries based on its training data.
The Urban Oven, despite its SEO success, loses potential customers because it's absent from the AI's conversation.
This new change requires a different playbook, and that’s exactly what LLM optimization software addresses. In the above example, an LLM optimization software would have identified the gap and allowed them to adjust their content to become a source that AI models learn from and recommend.
In simpler terms, LLM optimization software typically tracks how often and in what context AI models mention your brand, products, or content. It analyzes which user prompts trigger these mentions and assesses the sentiment.
Without this data, you're marketing in the dark, potentially missing a massive wave of conversational search traffic. So, today, investing in a top-rated LLM optimization software for AI is no longer optional; it's a fundamental step for any brand that wants to remain discoverable.
😀Fun fact: The global market for large language models (LLMs) is projected to grow from about USD 6.4 billion in 2024 to roughly USD 36.1 billion by 2030. |
Are LLMs Recommending Your Competitors?
Paste any page URL and get a free, AI-ready llms.txt file in one click, a simple first step toward getting cited by AI search.
Top-rated LLM optimization software for AI in 2026
Below are the top-rated LLM optimization software for AI:
Tool Name | USP | Pricing |
Instantly maps your brand’s presence against competitors across AI search interfaces, pinpointing exactly where you are missing in the LLM environment. | Custom pricing | |
Protect your business’s reputation and authority within AI-generated answers. | Starts from $69.95 for small teams. | |
Identify content gaps by revealing which external sources LLMs frequently cite for your key topics, informing your content strategy. | Starts from $250 per month. | |
Identify the exact third-party websites and pages that AI tools most frequently cite for your industry or topics. | Starts from $129 per month. | |
Generate brand visibility index reports that compare your frequency and sentiment against key competitors. | Starts from $29 per month. | |
Identify the specific web sources that LLMs reference to reveal citation opportunities competitors miss. | Starts from ~$102 per month. | |
View all referenced sources and domains that AI answers cite for a given query. | Starts from $20 per month. | |
Provides immediate, usable insights into AI search visibility with a zero-setup, intuitive dashboard. | Starts from $69 per month. | |
Measures brand authority and share of voice specifically within AI-generated answers. | N/A | |
Integrates AI visibility metrics directly into the existing Semrush SEO dashboard ecosystem. | Custom pricing |

via seoClarity
G2 Rating: 4.5 out of 5 starts
A top-rated LLM optimization software for AI 2025, seoClarity moves beyond traditional SEO by addressing how large language models (LLMs) like ChatGPT, Gemini, and Perplexity select and deliver information.
The platform gives enterprises the tools to track their brand's visibility within these AI conversations, research the prompts users are actually employing, and understand how AI bots interpret their site content. This end-to-end approach allows teams to directly influence whether they are cited as a source in AI-generated answers, turning AI search into a measurable channel for growth and authority.
Best features:
Detects when an AI model presents inaccurate or negative information about your brand, providing the clarity needed to correct the record.
Reveals the crawl behavior of AI-specific search bots on your site, allowing you to fix indexation gaps that block content from being considered.
Connects AI search visibility directly to business outcomes by measuring which pages and content drive actual conversions from AI-generated answers.

via Waikay
G2 Rating: N/A
Waikay provides specialized AI Search Optimization (AIO) for businesses and also gives brands direct insight into how they are portrayed by major LLMs like ChatGPT, Gemini, and Perplexity.
The platform moves beyond simple monitoring by identifying specific knowledge gaps, factual inaccuracies, and competitive positioning within AI model outputs. This allows companies to move from passive observation to actively managing their AI narrative.
Best features:
Automatically scans AI-generated content for factual errors about your brand, sending immediate alerts. This allows you to address inaccuracies or outdated information before they can harm your reputation.
Measures your brand's visibility against key competitors across multiple AI prompts and models over time, giving you a clear picture of your market share within AI conversations.
Generates specific, topic-level action plans. These plans include recommended improvements and backlink opportunities, providing a direct path to optimize your content for better AI recognition.

via Scrunch
G2 Rating: 4.7 out of 5 starts
Scrunch equips businesses to navigate their visibility within Large Language Models (LLMs) like ChatGPT and Claude by analyzing a brand's position and sentiment in AI-generated answers.
It pinpoints which specific topics, prompts, and competitors influence your appearance. A core component is the Scrunch Agent Experience Platform (AXP), which automatically creates an AI-optimized version of your website. This parallel site is served exclusively to AI traffic, ensuring these new bots can effectively read and cite your most accurate content, directly influencing how you are presented in AI search results.
Best features:
Intercept AI-specific web traffic through integrations like Cloudflare and Vercel to serve a dedicated, optimized site version.
Generate a parallel, AI-friendly site structure by automatically stripping away superfluous code that hinders bot comprehension.
Track performance and share of voice across different LLMs, filtering results by region, topic, and custom personas.

via Ahref Brand Radar
G2 Rating: 4.5 out of 5 starts
Ahrefs Brand Radar, an AI visibility platform, tracks brand mentions, citations, and search demand across multiple AI indexes, including Google AI Overviews, ChatGPT, Perplexity, Gemini, and Copilot.
The platform enables competitive benchmarking and detailed analysis of the content sources that AI systems cite, allowing marketing teams to identify inaccuracies in their brand narrative, discover content gaps compared to rivals, and understand the specific topics and queries where they have the strongest AI presence.
This best LLM optimization tool integrates with Ahrefs' broader SEO ecosystem, providing a data-driven workflow to protect brand integrity and capture a larger share of voice in AI search environments.
Best features:
Track brand presence and measure share of voice across six major AI platforms, including ChatGPT and Google AI Overviews.
Analyze specific AI-generated responses to verify factual accuracy and identify outdated or incorrect brand information.
Benchmark your brand’s visibility metrics directly against selected competitors to uncover strategic gaps and opportunities.

via Otterly.ai
G2 Rating: 4.9 out of 5 stars
Otterly.ai specializes in monitoring how your brand is presented within AI-generated search results by capturing not just keywords but link citations, prompt-based interactions, and brand sentiment.
Its system performs real-human-like monitoring from different global locations, providing a practical view of how LLMs present a brand. This focus helps content creators and marketers understand their GEO, or Generative Engine Optimization, standing and adapt their material for better AI search performance.
Best features:
Monitor all link citations to see which URLs rank within AI answers and assess the associated sentiment.
Research relevant search prompts to understand audience inquiries and receive content optimization suggestions.
Perform technical, in-depth GEO audits on web pages to receive actionable structural improvements.

via Peec AI
G2 Rating: 5.0 out 5 stars
Peec AI is a specialized analytics platform built exclusively for tracking brand presence within large language models. This best LLM optimization tool measures three core metrics: your visibility share in AI conversations, the ranking position of those mentions, and the overall sentiment of the model's response.
Its dashboards support multi-country and multilingual tracking, giving global teams a clear view of regional performance variances. This approach helps marketing teams identify which sources the LLMs reference, revealing why certain content gets cited while yours may not.
Best features:
Build custom libraries of high-impact prompts relevant to your specific industry.
Benchmark your brand's visibility percentage directly against competitor scores for the same prompts.
Analyze which third-party websites LLMs most frequently cite for your key topics.
Receive instant alerts for significant ranking fluctuations within your tracked prompts.
View performance data across different AI models to identify platform-specific strengths.
via Rankscale AI
G2 Rating: N/A
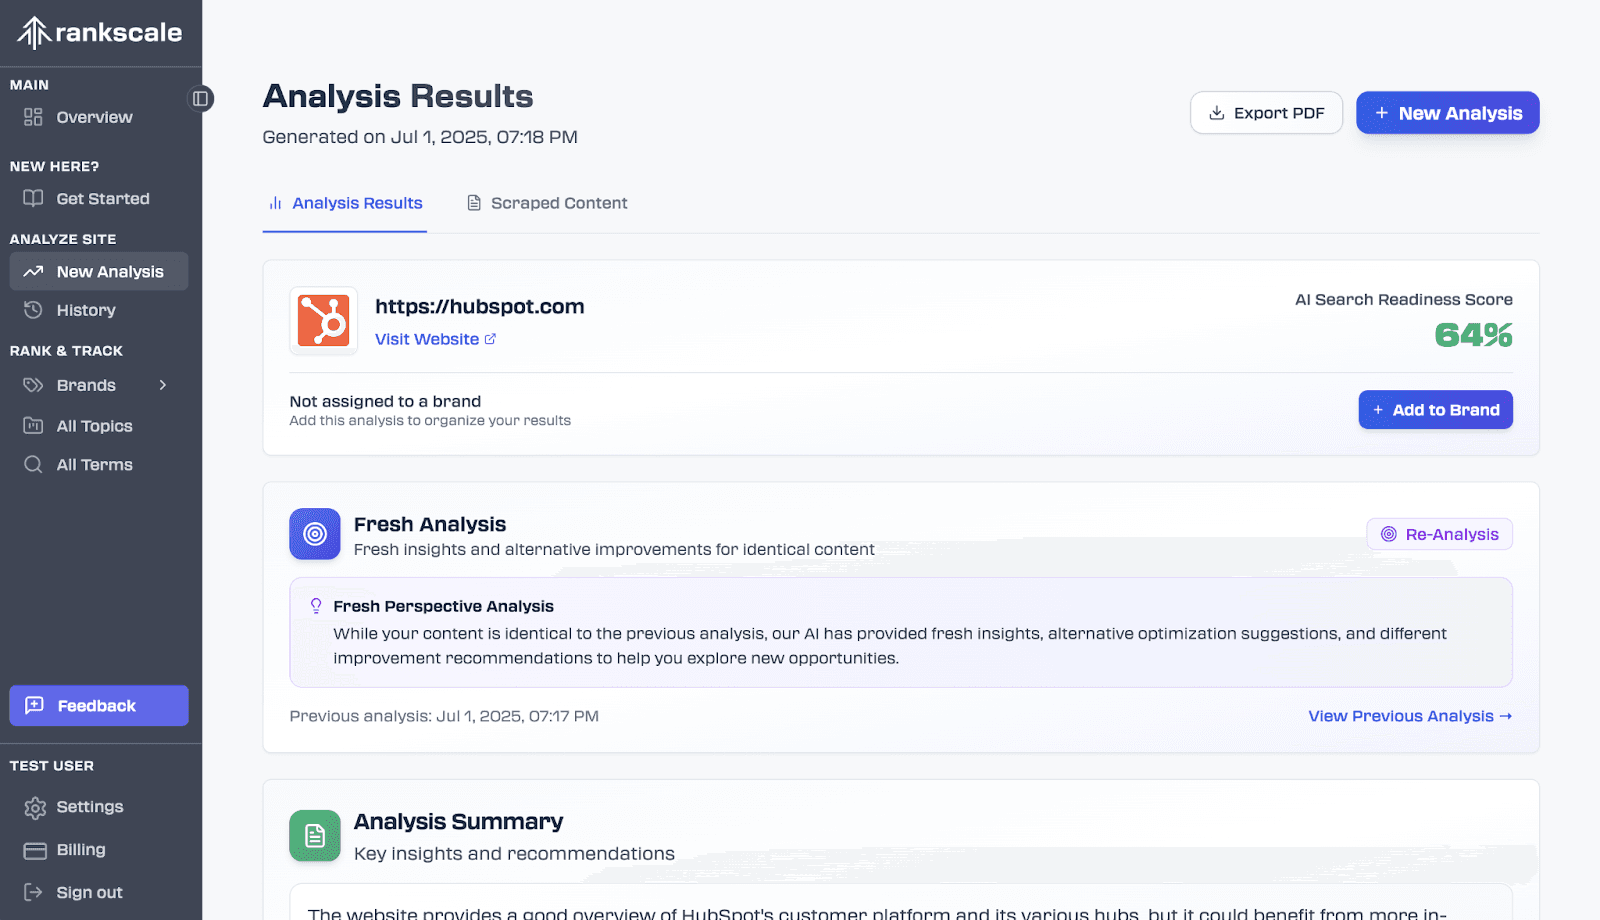
Rankscale AI, a top GEO platform, approaches AI search not as a universal ranking but as a variable outcome, personalizing tracking for specific search terms, regions, and individual AI models.
This top-rated LLM optimization software for AI 2025 platform provides a centralized command center, ideal for agencies managing multiple brands, to see a consolidated view of performance. Its system calculates a detailed AI readiness score for websites, evaluating content, technical structure, authority, and engagement factors to pinpoint exactly how AI crawlers interpret your pages.
Best features:
Identify and monitor competing brands automatically from the search terms and topics you track.
Gauge brand perception through sentiment scores and associated keyword analysis.
Evaluate site-wide AI readiness with multi-page crawl-based technical audits.
Slice performance data by custom timeframes for period-over-period comparisons.

via ZipTie.dev
G2 Rating: N/A
ZipTie.dev plugs directly into platforms like Google AI Overviews, ChatGPT, and Perplexity to show where your brand appears and which content gets cited.
This LLM evaluation tool is built for immediate use, requiring minimal setup to begin tracking topic-level visibility, link citations, and conversation demand. It delivers real-time insights like where rivals can emerge from in an AI answer.
Best features:
Identify the specific sources and websites that influence AI answers in your industry.
Set up automated, regular monitoring for changes in AI Overviews and featured snippets.
Diagnose and understand website indexing issues that can prevent appearance in AI results.
Track performance metrics across different geographical regions and platforms.

via Seer Interactive
G2 Rating: N/A
Seer Interactive’s GenAI Answer Tracker is focused on how brands are portrayed within answers from large language models. It measures your brand's Share of Voice within AI conversations, identifying which topics and competitors are also present. Further, it filters data by specific topics to see which conversations include or exclude your brand.
Best features:
Visualize your brand’s presence and authority through a proprietary Signals Score.
Identify competing brands that consistently appear in AI answers for your key themes.
Monitor changes in your AI mentions and share of voice over a defined period.
Analyze the context of brand mentions to assess the quality and sentiment of the AI’s output.

via Semrush Enterprise AIO
G2 Rating: 4.5 out of 5 stars
Semrush Enterprise AIO offers an enterprise-level solution for monitoring brand presence within AI search platforms. It treats user prompts similarly to traditional keywords, adding them for systematic tracking and analysis.
This popular LLM evaluation tool is built for large-scale operations needing precise data on brand mentions, sentiment, and competitive share of voice. For teams already using the Semrush ecosystem, it integrates directly, providing a unified view of SEO and AI search performance. Its strength lies in combining extensive AI platform coverage with the deep data infrastructure Semrush is known for.
Best features:
Identify technical website errors, like missing schema, that prevent LLMs from properly crawling your content.
Compare your brand's share of voice and sentiment directly against competitor data.
Generate customized reports for presentations by integrating findings with the ‘My Reports' tool.
Access dedicated expert support for developing your AI search strategy.
Assess the credibility and contextual placement of sources that cite your brand.
Why Fibr stands out when it comes to LLM optimization for AI
Firstly, Fibr AI integrates traditional conversion optimization with critical GEO tracking. Unlike other tools that focus solely on where your brand appears in AI search, Fibr connects this visibility directly to on-site user behavior and business outcomes.
It also provides clear GEO metrics, like Mention Rate, Average Position, and Sentiment in LLM responses and then automatically uses those insights to power personalization, A/B testing, and performance monitoring across the site.
So, you are not just tracking rankings; you are actively using them to drive growth.
Want to test Fibr AI? Start a 30-day free trial with Fibr AI today!
Your Next Visitor Might Not Be Human
AI agents are changing how buyers search and decide. Here's how to make sure how buyers choose you.
FAQs about top-rated LLM optimization software for AI
What is AI LLM optimisation?
AI LLM optimisation refers to refining large-language-model systems so they perform better, faster, and more reliably. This includes fine-tuning the model, reducing errors or 'hallucinations,' managing latency and memory use, and aligning outputs with user goals or business tasks.
What are the best AI LLMs?
There is no single 'best' model, but several leading options dominate current performance and adoption. Models such as GPT‑4.5, Claude 3.7, Gemini 2.5 Pro, and open-source alternatives like Llama 3 or Mistral Large 2 are frequently cited for their balanced capabilities across reasoning, language understanding, and deployment flexibility.
How to optimize LLM performance?
Start by selecting and tuning the right model for your use case: use prompt engineering, retrieval-augmented generation (RAG) to bring in fresh/contextual data, quantization, or model-pruning for faster inference, and monitor latency, throughput, and error rates. Set up logging, feedback loops, and test fall-backs for when things go off track.
Can LLM be used for optimisation?
Yes. You can use an LLM to optimise other systems. For example, it can generate optimised prompts, sift logs to suggest improvements, automate agent-based workflow decisions, or analyse large data sets and suggest efficiency gains. In short, the LLM becomes the optimisation assistant rather than just the engine.





Meenal Chirana
Content Marketing Manager
Meenal Chirana, Content Marketer at Fibr, brings five years of experience in the content field to the team. Her passion for creating engaging content is matched only by her expertise in writing, SEO and content marketing . Passionate about all things content and digital marketing, she is always on the lookout for innovative ways to connect with audiences and elevate brands.
Read summarized version with
Are you confident your content is being surfaced by AI assistants like ChatGPT and Google AI Overviews? As these platforms redefine search, traditional SEO is no longer enough. Brands now need a new discipline focused on Generative Engine Optimization, or GEO, to ensure visibility where answers are conversationally generated.
To navigate this shift, you need the right AI model optimization software. And to help you, we analyzed platforms that monitor your presence across major AI engines and ensure you remain visible to your audience no matter how they find information.
In this blog, we uncover the top-rated LLM optimization software for AI to help you choose the best one for your unique needs.
🕰️ TL;DR
|
Every Visitor Sees the Same Page. That's the Problem.
See where your site could personalize and test for different visitors, with a free analysis of your URL.
Why do businesses need LLM optimization software for AI?
Traditional SEO is no longer sufficient. Search is shifting from links on a page to answers in a chatbox. Take this example. A local bakery, 'The Urban Oven,' ranks #1 on Google for 'best sourdough in Brooklyn.' However, when people ask Perplexity AI 'where to find authentic sourdough bread in Brooklyn,' the AI recommends two other bakeries based on its training data.
The Urban Oven, despite its SEO success, loses potential customers because it's absent from the AI's conversation.
This new change requires a different playbook, and that’s exactly what LLM optimization software addresses. In the above example, an LLM optimization software would have identified the gap and allowed them to adjust their content to become a source that AI models learn from and recommend.
In simpler terms, LLM optimization software typically tracks how often and in what context AI models mention your brand, products, or content. It analyzes which user prompts trigger these mentions and assesses the sentiment.
Without this data, you're marketing in the dark, potentially missing a massive wave of conversational search traffic. So, today, investing in a top-rated LLM optimization software for AI is no longer optional; it's a fundamental step for any brand that wants to remain discoverable.
😀Fun fact: The global market for large language models (LLMs) is projected to grow from about USD 6.4 billion in 2024 to roughly USD 36.1 billion by 2030. |
Are LLMs Recommending Your Competitors?
Paste any page URL and get a free, AI-ready llms.txt file in one click, a simple first step toward getting cited by AI search.
Top-rated LLM optimization software for AI in 2026
Below are the top-rated LLM optimization software for AI:
Tool Name | USP | Pricing |
Instantly maps your brand’s presence against competitors across AI search interfaces, pinpointing exactly where you are missing in the LLM environment. | Custom pricing | |
Protect your business’s reputation and authority within AI-generated answers. | Starts from $69.95 for small teams. | |
Identify content gaps by revealing which external sources LLMs frequently cite for your key topics, informing your content strategy. | Starts from $250 per month. | |
Identify the exact third-party websites and pages that AI tools most frequently cite for your industry or topics. | Starts from $129 per month. | |
Generate brand visibility index reports that compare your frequency and sentiment against key competitors. | Starts from $29 per month. | |
Identify the specific web sources that LLMs reference to reveal citation opportunities competitors miss. | Starts from ~$102 per month. | |
View all referenced sources and domains that AI answers cite for a given query. | Starts from $20 per month. | |
Provides immediate, usable insights into AI search visibility with a zero-setup, intuitive dashboard. | Starts from $69 per month. | |
Measures brand authority and share of voice specifically within AI-generated answers. | N/A | |
Integrates AI visibility metrics directly into the existing Semrush SEO dashboard ecosystem. | Custom pricing |
via seoClarity
G2 Rating: 4.5 out of 5 starts
A top-rated LLM optimization software for AI 2025, seoClarity moves beyond traditional SEO by addressing how large language models (LLMs) like ChatGPT, Gemini, and Perplexity select and deliver information.
The platform gives enterprises the tools to track their brand's visibility within these AI conversations, research the prompts users are actually employing, and understand how AI bots interpret their site content. This end-to-end approach allows teams to directly influence whether they are cited as a source in AI-generated answers, turning AI search into a measurable channel for growth and authority.
Best features:
Detects when an AI model presents inaccurate or negative information about your brand, providing the clarity needed to correct the record.
Reveals the crawl behavior of AI-specific search bots on your site, allowing you to fix indexation gaps that block content from being considered.
Connects AI search visibility directly to business outcomes by measuring which pages and content drive actual conversions from AI-generated answers.
via Waikay
G2 Rating: N/A
Waikay provides specialized AI Search Optimization (AIO) for businesses and also gives brands direct insight into how they are portrayed by major LLMs like ChatGPT, Gemini, and Perplexity.
The platform moves beyond simple monitoring by identifying specific knowledge gaps, factual inaccuracies, and competitive positioning within AI model outputs. This allows companies to move from passive observation to actively managing their AI narrative.
Best features:
Automatically scans AI-generated content for factual errors about your brand, sending immediate alerts. This allows you to address inaccuracies or outdated information before they can harm your reputation.
Measures your brand's visibility against key competitors across multiple AI prompts and models over time, giving you a clear picture of your market share within AI conversations.
Generates specific, topic-level action plans. These plans include recommended improvements and backlink opportunities, providing a direct path to optimize your content for better AI recognition.
via Scrunch
G2 Rating: 4.7 out of 5 starts
Scrunch equips businesses to navigate their visibility within Large Language Models (LLMs) like ChatGPT and Claude by analyzing a brand's position and sentiment in AI-generated answers.
It pinpoints which specific topics, prompts, and competitors influence your appearance. A core component is the Scrunch Agent Experience Platform (AXP), which automatically creates an AI-optimized version of your website. This parallel site is served exclusively to AI traffic, ensuring these new bots can effectively read and cite your most accurate content, directly influencing how you are presented in AI search results.
Best features:
Intercept AI-specific web traffic through integrations like Cloudflare and Vercel to serve a dedicated, optimized site version.
Generate a parallel, AI-friendly site structure by automatically stripping away superfluous code that hinders bot comprehension.
Track performance and share of voice across different LLMs, filtering results by region, topic, and custom personas.
via Ahref Brand Radar
G2 Rating: 4.5 out of 5 starts
Ahrefs Brand Radar, an AI visibility platform, tracks brand mentions, citations, and search demand across multiple AI indexes, including Google AI Overviews, ChatGPT, Perplexity, Gemini, and Copilot.
The platform enables competitive benchmarking and detailed analysis of the content sources that AI systems cite, allowing marketing teams to identify inaccuracies in their brand narrative, discover content gaps compared to rivals, and understand the specific topics and queries where they have the strongest AI presence.
This best LLM optimization tool integrates with Ahrefs' broader SEO ecosystem, providing a data-driven workflow to protect brand integrity and capture a larger share of voice in AI search environments.
Best features:
Track brand presence and measure share of voice across six major AI platforms, including ChatGPT and Google AI Overviews.
Analyze specific AI-generated responses to verify factual accuracy and identify outdated or incorrect brand information.
Benchmark your brand’s visibility metrics directly against selected competitors to uncover strategic gaps and opportunities.
via Otterly.ai
G2 Rating: 4.9 out of 5 stars
Otterly.ai specializes in monitoring how your brand is presented within AI-generated search results by capturing not just keywords but link citations, prompt-based interactions, and brand sentiment.
Its system performs real-human-like monitoring from different global locations, providing a practical view of how LLMs present a brand. This focus helps content creators and marketers understand their GEO, or Generative Engine Optimization, standing and adapt their material for better AI search performance.
Best features:
Monitor all link citations to see which URLs rank within AI answers and assess the associated sentiment.
Research relevant search prompts to understand audience inquiries and receive content optimization suggestions.
Perform technical, in-depth GEO audits on web pages to receive actionable structural improvements.
via Peec AI
G2 Rating: 5.0 out 5 stars
Peec AI is a specialized analytics platform built exclusively for tracking brand presence within large language models. This best LLM optimization tool measures three core metrics: your visibility share in AI conversations, the ranking position of those mentions, and the overall sentiment of the model's response.
Its dashboards support multi-country and multilingual tracking, giving global teams a clear view of regional performance variances. This approach helps marketing teams identify which sources the LLMs reference, revealing why certain content gets cited while yours may not.
Best features:
Build custom libraries of high-impact prompts relevant to your specific industry.
Benchmark your brand's visibility percentage directly against competitor scores for the same prompts.
Analyze which third-party websites LLMs most frequently cite for your key topics.
Receive instant alerts for significant ranking fluctuations within your tracked prompts.
View performance data across different AI models to identify platform-specific strengths.
via Rankscale AI
G2 Rating: N/A
Rankscale AI, a top GEO platform, approaches AI search not as a universal ranking but as a variable outcome, personalizing tracking for specific search terms, regions, and individual AI models.
This top-rated LLM optimization software for AI 2025 platform provides a centralized command center, ideal for agencies managing multiple brands, to see a consolidated view of performance. Its system calculates a detailed AI readiness score for websites, evaluating content, technical structure, authority, and engagement factors to pinpoint exactly how AI crawlers interpret your pages.
Best features:
Identify and monitor competing brands automatically from the search terms and topics you track.
Gauge brand perception through sentiment scores and associated keyword analysis.
Evaluate site-wide AI readiness with multi-page crawl-based technical audits.
Slice performance data by custom timeframes for period-over-period comparisons.
via ZipTie.dev
G2 Rating: N/A
ZipTie.dev plugs directly into platforms like Google AI Overviews, ChatGPT, and Perplexity to show where your brand appears and which content gets cited.
This LLM evaluation tool is built for immediate use, requiring minimal setup to begin tracking topic-level visibility, link citations, and conversation demand. It delivers real-time insights like where rivals can emerge from in an AI answer.
Best features:
Identify the specific sources and websites that influence AI answers in your industry.
Set up automated, regular monitoring for changes in AI Overviews and featured snippets.
Diagnose and understand website indexing issues that can prevent appearance in AI results.
Track performance metrics across different geographical regions and platforms.
via Seer Interactive
G2 Rating: N/A
Seer Interactive’s GenAI Answer Tracker is focused on how brands are portrayed within answers from large language models. It measures your brand's Share of Voice within AI conversations, identifying which topics and competitors are also present. Further, it filters data by specific topics to see which conversations include or exclude your brand.
Best features:
Visualize your brand’s presence and authority through a proprietary Signals Score.
Identify competing brands that consistently appear in AI answers for your key themes.
Monitor changes in your AI mentions and share of voice over a defined period.
Analyze the context of brand mentions to assess the quality and sentiment of the AI’s output.
via Semrush Enterprise AIO
G2 Rating: 4.5 out of 5 stars
Semrush Enterprise AIO offers an enterprise-level solution for monitoring brand presence within AI search platforms. It treats user prompts similarly to traditional keywords, adding them for systematic tracking and analysis.
This popular LLM evaluation tool is built for large-scale operations needing precise data on brand mentions, sentiment, and competitive share of voice. For teams already using the Semrush ecosystem, it integrates directly, providing a unified view of SEO and AI search performance. Its strength lies in combining extensive AI platform coverage with the deep data infrastructure Semrush is known for.
Best features:
Identify technical website errors, like missing schema, that prevent LLMs from properly crawling your content.
Compare your brand's share of voice and sentiment directly against competitor data.
Generate customized reports for presentations by integrating findings with the ‘My Reports' tool.
Access dedicated expert support for developing your AI search strategy.
Assess the credibility and contextual placement of sources that cite your brand.
Why Fibr stands out when it comes to LLM optimization for AI
Firstly, Fibr AI integrates traditional conversion optimization with critical GEO tracking. Unlike other tools that focus solely on where your brand appears in AI search, Fibr connects this visibility directly to on-site user behavior and business outcomes.
It also provides clear GEO metrics, like Mention Rate, Average Position, and Sentiment in LLM responses and then automatically uses those insights to power personalization, A/B testing, and performance monitoring across the site.
So, you are not just tracking rankings; you are actively using them to drive growth.
Want to test Fibr AI? Start a 30-day free trial with Fibr AI today!
Your Next Visitor Might Not Be Human
AI agents are changing how buyers search and decide. Here's how to make sure how buyers choose you.
FAQs about top-rated LLM optimization software for AI
What is AI LLM optimisation?
AI LLM optimisation refers to refining large-language-model systems so they perform better, faster, and more reliably. This includes fine-tuning the model, reducing errors or 'hallucinations,' managing latency and memory use, and aligning outputs with user goals or business tasks.
What are the best AI LLMs?
There is no single 'best' model, but several leading options dominate current performance and adoption. Models such as GPT‑4.5, Claude 3.7, Gemini 2.5 Pro, and open-source alternatives like Llama 3 or Mistral Large 2 are frequently cited for their balanced capabilities across reasoning, language understanding, and deployment flexibility.
How to optimize LLM performance?
Start by selecting and tuning the right model for your use case: use prompt engineering, retrieval-augmented generation (RAG) to bring in fresh/contextual data, quantization, or model-pruning for faster inference, and monitor latency, throughput, and error rates. Set up logging, feedback loops, and test fall-backs for when things go off track.
Can LLM be used for optimisation?
Yes. You can use an LLM to optimise other systems. For example, it can generate optimised prompts, sift logs to suggest improvements, automate agent-based workflow decisions, or analyse large data sets and suggest efficiency gains. In short, the LLM becomes the optimisation assistant rather than just the engine.
Meenal Chirana
Content Marketing Manager
Meenal Chirana, Content Marketer at Fibr, brings five years of experience in the content field to the team. Her passion for creating engaging content is matched only by her expertise in writing, SEO and content marketing . Passionate about all things content and digital marketing, she is always on the lookout for innovative ways to connect with audiences and elevate brands.