

Table of Content
Read summarized version with
Introduction
Guilty…I used to be one of those who obsess over traffic charts, those innocent ones watching those little blue lines climb and feeling sure that more visitors meant more sales.
Then I had a month where traffic grew by 40% and revenue barely moved.
I felt like I was throwing a huge party and most people left before they even reached the bar. That was my wake up call.
That was when I stopped running after visits and started optimizing my sites and pages for conversions.
But conversions are hard. According to Statista, the average conversion rate across all ecommerce sites is under 2 percent, which means more than 98 out of 100 visitors typically leave without taking any action. Bummer!
So it was clear…I did not need more people at the door, I needed more people saying yes. After all, traffic is attention, not income.
Conversion rate optimization, or CRO, is how we solve this.
And that’s what we are dissecting today: the A-to-Z of proper conversion rate optimization. Let’s begin
What is CRO, and Why Should You Care?
After I learned the hard way that traffic does not automatically equal sales, I went looking for what I was doing wrong. My mistake was not paying enough attention to Conversion Rate Optimization.
CRO is the structured process of improving your website or funnel so a higher percentage of visitors complete the actions that matter to your business. That could be buying a product, filling out a form, booking a call or demo, signing up for your newsletter, creating an account or starting a free trial.
To put it simply, traffic gets people in the room and CRO helps them feel comfortable enough to say yes.
To do that, CRO usually includes things like
Looking at analytics, heatmaps, and recordings to see where people get stuck
Talking to customers or running surveys to understand what they need
Testing different headlines, layouts, and offers instead of guessing
Why should you care?
When you look at the numbers, you’ll find it impossible to see CRO as an option.
Recent benchmarks will tell you that the average ecommerce conversion rate is around 2.58 percent, which means roughly 97 out of 100 visitors leave without buying anything. That is a lot of unrealized potential sitting in your analytics.
You also are not alone if your current results feel underwhelming. Studies show only about 22 percent of businesses are satisfied with their conversion rates, so most teams are still not getting to the full potential of their business.
On top of that, research based on Econsultancy data found that for every 92 dollars spent acquiring customers, only 1 dollar is spent converting them.
All of this means that if you take CRO seriously, you are working where most competitors are not. You are turning existing traffic into revenue. Now, let’s see how you can do that in practice…
From Theory to Practice: CRO Implementation Framework
Look, you can read about CRO theory all day long, but at some point you need to roll up your sleeves and start optimizing. The good news is that there's a proven framework that takes the confusion out of the process.
Let's walk through the five-step framework that successful companies use to systematically improve their conversion rates
Step 1: Audit and baseline
Before you change anything, you need to know where you stand. Seems obvious, right?
Yet you'd be surprised how many teams skip this step and jump straight into testing random ideas.
Your audit should dig into several key areas:
Analytics deep dive: First, find out where are visitors dropping off, which pages have terrible bounce rates, and what's your current conversion rate by traffic source, device, and landing page.
Technical performance: Figure out how fast do your pages load, are there console errors, and if everything work on mobile.
User experience review: Click through your own site like a first-time visitor. Where do you get confused? What questions go unanswered?
Competitive analysis: Find out what similar companies are doing (Not to copy them blindly, but to understand market expectations)
If you don't know you're converting at 2.3% right now, how will you know if you've improved to 2.8% later? Document everything.
Step 2: Hypothesis and prioritization
Now that you know what's broken, resist the urge to fix everything at once. You need a system for deciding what to handle first.
Start by forming hypotheses based on your audit findings. A good hypothesis follows this format:
If we [make this change] for [this audience], then [this metric] will improve because [this reason].
For example:
"If we add trust badges to the checkout page for first-time visitors, then cart abandonment will decrease because users will feel more confident entering payment information."
"If we simplify our pricing page from five tiers to three tiers for small business visitors, then conversions will increase because decision paralysis will be reduced."
Notice how specific these are? That's what makes them testable.
Once you've got a list of hypotheses, you need to prioritize them. Most teams use some variation of the ICE framework:
Impact: How much will this make an impact? (1-10)
Confidence: How sure are you this will work? (1-10)
Ease: How simple is it to implement? (1-10)
Add up the scores, and tackle the highest-scoring items first. This keeps you focused on changes that could matter rather than spending weeks tweaking button colors that won't impact revenue.
Step 3: Test you design with A/B and multivariate tests
Time to actually run some experiments. There are two main types you'll use:
A/B testing is the simpler approach. You create two versions (A and B) and split your traffic between them to see which performs better. Maybe version A has your current headline and version B has a new one. Clean, straightforward, easy to analyze.
Multivariate testing is more complex. You're testing multiple changes simultaneously to see how they interact.
For instance, you might test three different headlines, two different images, and two different CTA buttons all at once. That's 12 different combinations (3 x 2 x 2). This requires significantly more traffic to reach statistical significance, but it can uncover insights about how elements work together.
But what makes a good test?
Single variable focus (for A/B tests): Change one thing at a time so you know what drove the results
Sufficient sample size: You need enough visitors to reach statistical significance, usually at least a few thousand conversions
Proper test duration: Run tests for at least one full business cycle (usually 2-4 weeks) to account for day-of-week variations
Clean implementation: Make sure your testing tool is properly installed and not causing flickering or page load issues
This is where modern tools can really accelerate your testing velocity. Platforms like Fibr AI let you run multiple personalized experiments simultaneously without needing a developer.
Instead of spending weeks building test variations manually, you can create personalized landing pages that automatically match your ad messaging, keywords, or audience segments, then test them against each other to see which approaches convert best.
Step 4: Analyze and iterate
Your test finished running. Now what? This is where a lot of teams fumble. They look at the conversion rate of A versus B, declare a winner, and move on. But there's so much more to learn if you dig deeper.
Ask these questions:
Did we reach statistical significance? A 95% confidence level is the standard. Anything less and you're making decisions based on false assumptions.
How did different segments perform? Maybe version B won overall, but version A worked better for mobile users or first-time visitors
What secondary metrics changed? Did the winning version also improve time on page, reduce bounce rate, or affect average order value?
What did we learn about user behavior? Even losing tests teach you something about what resonates with your audience
Document your findings. Seriously, write them down. Six months from now when you're testing something similar, you'll want to reference what you learned.
Then comes the iteration part. Winning tests don't mean you're done—they mean you've found a new baseline to improve upon. If simplifying your headline worked, what if you simplified your entire page layout? If adding trust badges helped, what if you added more specific ones? Keep pushing.
Step 5: Scale your winning experiments
I will assume at this point, you've found something that works. Great! Now don't let that win sit on a single landing page.
The final step is taking your successful tests and scaling them across your entire website, marketing campaigns, and customer touchpoints.
This might mean
Applying the winning element to similar pages: If a new headline format worked on your pricing page, test it on your product pages too
Building it into your templates: Make your winning patterns the new default for future pages
Sharing insights across teams: If your landing page team discovered something, tell your email team; they might be able to use it too
Creating a strategy: Document what works so new team members can benefit from your institutional knowledge
Believe it or not, the companies that see exponential growth from CRO aren't the ones that run one test and call it a day. They're the ones that systematically scale their wins and create a culture of continuous optimization.
Modern AI-powered platforms are making this scaling process much faster. With Fibr AI, once you've identified a winning approach — say, matching your landing page headlines to your ad copy — you can automatically apply that formula across hundreds of ads and landing pages at once.
What used to take months of manual work now happens in minutes. This means you can scale winning experiments across entire campaigns without the bottleneck of creating each variation by hand.
Real world success stories of CRO
It is one thing to talk about CRO in theory. It feels very different when you see what a single thoughtful experiment can do in the real world. Here are a few stories I like to keep in mind
Obama 2008
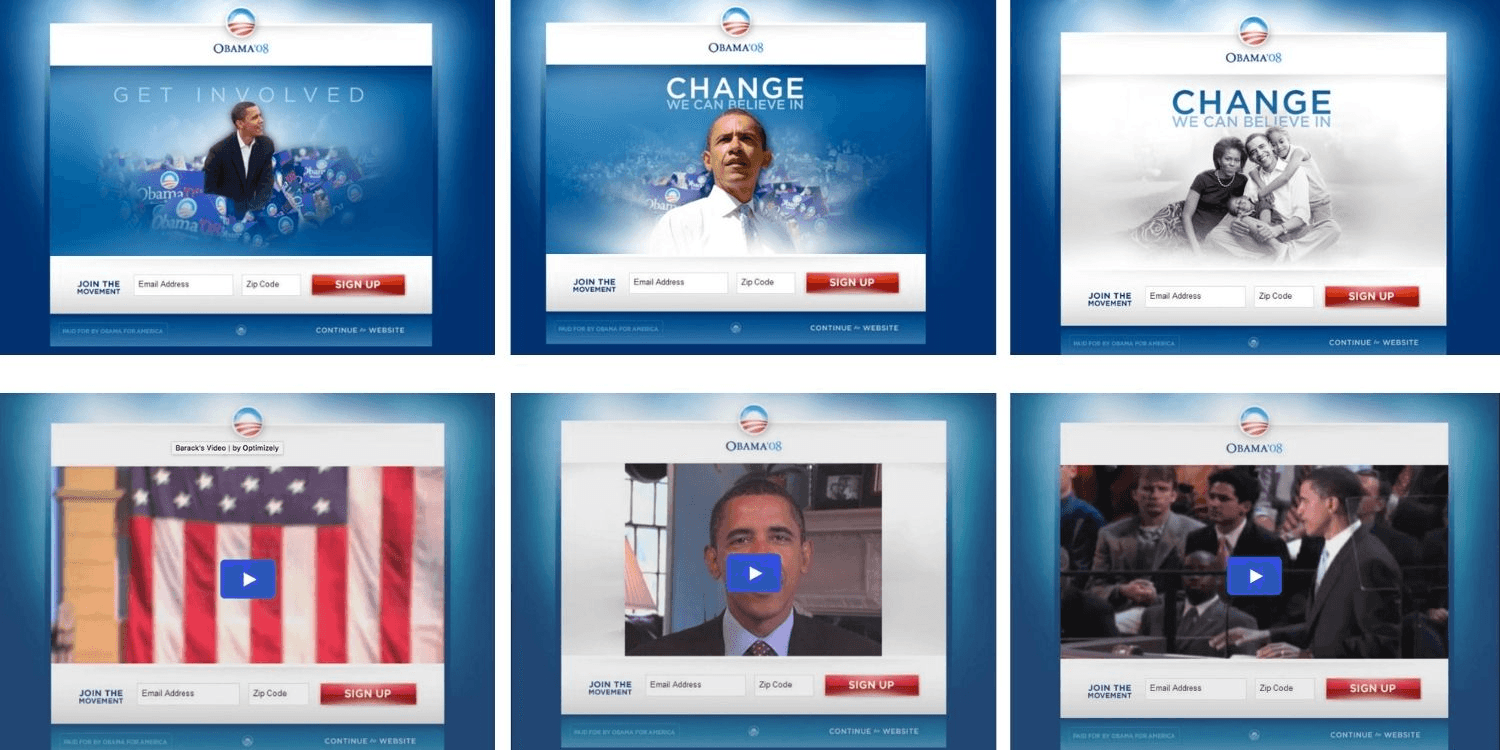
During the 2008 presidential campaign, the Obama team tested different images and button text on a simple splash page that asked visitors to join the email list. The original version converted 8.26 percent of visitors. The winning variation, with a more reassuring family photo and a softer call to action, converted 11.6 percent.
That lift of 40.6 percent in sign ups translated into roughly 2.8 million extra email addresses and an estimated 60 million dollars in additional donations.
What I love about this example is how ordinary it looks. No flashy redesign. Just careful testing of what people saw and what you asked them to do first.
Nature Air
Costa Rican airline Nature Air had a set of landing pages that were getting traffic but not many bookings. After watching user behavior, the team realised the call to action was visually buried.
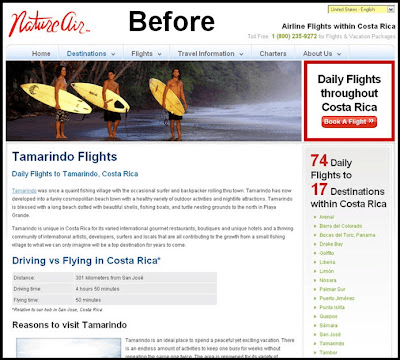
They tested a new layout that brought the main booking button into a much more prominent position, with clearer copy around it. The result was dramatic. Conversions jumped from 2.78 percent to 19 percent, which is a 591 percent increase in conversion rate.
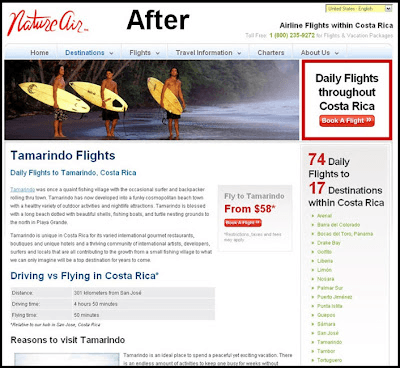
This story always reminds me that visitors cannot click what they do not notice. Good CRO often starts with simple questions about visibility and clarity, not complex psychological tricks.
TruckersReport
TruckersReport, a site that connects truck drivers with jobs and resources, ran a series of A B tests on a key lead generation page. They experimented with the headline, the structure of the form and the way benefits were presented.
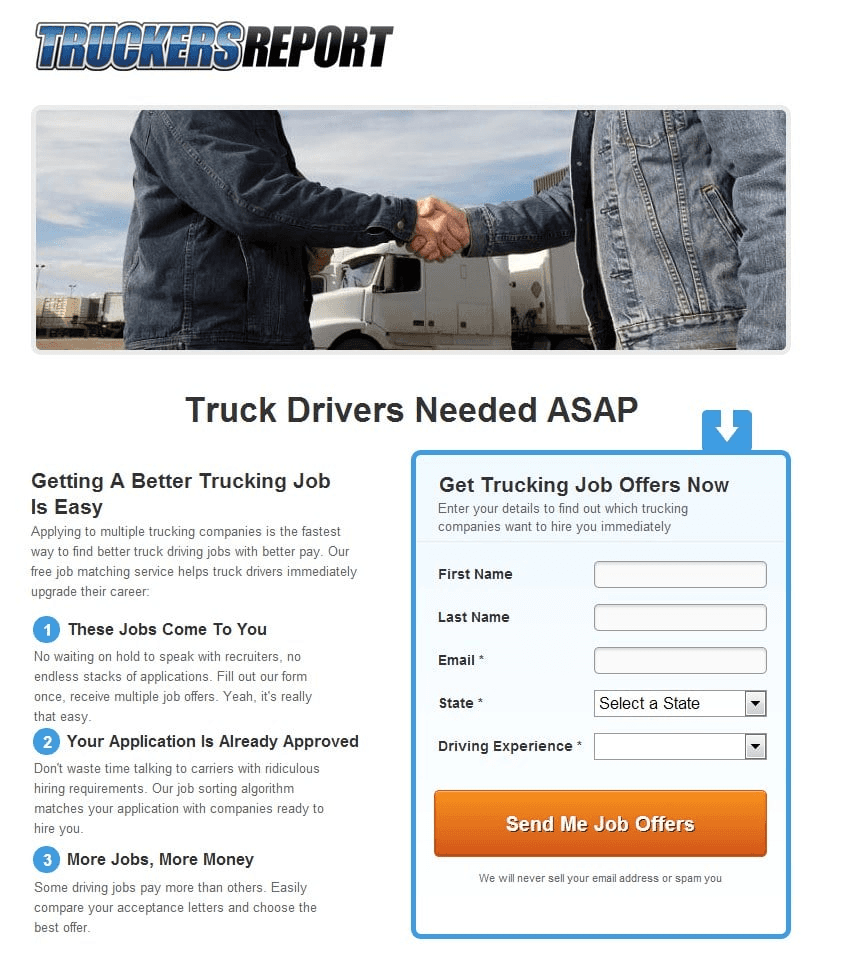
By iterating through several rounds, they ended up with a version that increased conversions significantly compared with the original.
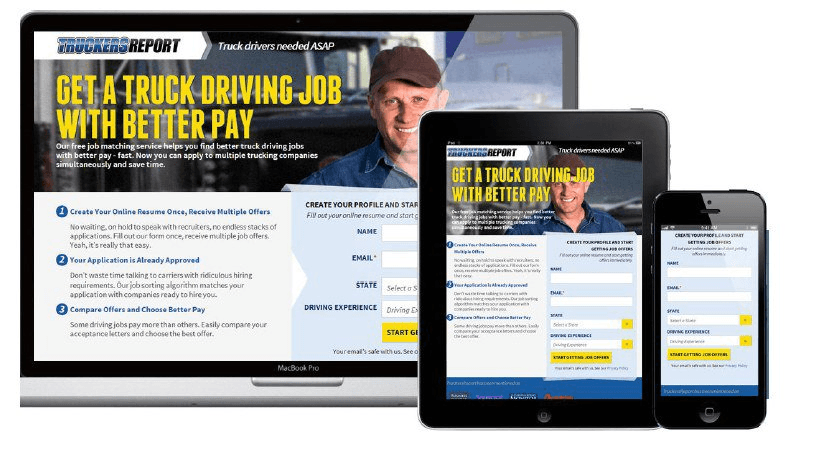
What stands out here is the process. There was no single magic tweak. The win came from treating the page like a living experiment and letting each round of data inform the next change
Mistakes to Avoid (Based on Common Misconceptions)
When I first got into CRO, I did not lack effort. I lacked focus. I chased every best practice I saw on marketing blogs and wondered why nothing really moved. Looking back, most of my mistakes came from very common misconceptions about what CRO actually is.
Here are the big ones I see over and over again, in my own work and in clients’ accounts
Mistake 1: Thinking more traffic is the fix
Ah…the classic one. Traffic feels exciting, because it is visible.
You see spikes in your analytics and it feels like progress. The reality is that if your page does not convert, pouring more visitors into it only produces more exits.
This mindset leads to overspending on ads, neglecting landing pages and funnels and blaming channels instead of fixing the offer or experience
Once I changed the question from How do I get more people here to How do I help the right people say yes, decisions became a lot clearer.
You do it by deeply understanding who your best visitors are, what they care about, and what is stopping them from acting, then reshaping your pages around those needs. In practice, that means clearer messaging, stronger proof, smoother paths to action and constant testing to see what truly helps them say yes.
Mistake 2: Copying competitors and big brands
I used to keep swipe files filled with screenshots from big-name websites. If a famous SaaS brand used a certain layout, I assumed it would work for every other product under the sun.
The problem is you do not see their data, their audience, or their tests. You only see the current winner for their specific context. When you copy them, you are not copying an insight. You are copying a guess.
In practice, this leads to
Headlines that sound nice but mean nothing to your audience
Funnel steps that slow people down instead of helping them decide
Complex pages that impress internal teams more than real visitors
Inspiration is helpful. Blind imitation is expensive.
Mistake 3: Testing too many things at once
Once you understand that testing is powerful, the temptation is to redesign entire pages in one go. New layout, new copy, new images, new pricing display, all in a single A/B test.
The issue is that even if the new version wins, you have no idea why. Was it the shorter form. The clearer headline. The simplified navigation. You gain a win, but lose a lesson.
Good CRO respects causality. Small, focused tests feel slower but they create a library of insights you can reuse across pages, campaigns, and even products.
Mistake 4: Obsessing over averages and ignoring segments
Another misconception is that there is one conversion rate that tells the whole story. In reality, averages hide more than they reveal.
Here are things I now look at separately
Mobile versus desktop
New visitors versus returning visitors
Traffic by channel (search, social, email, direct, referrals)
Key countries or regions
I have seen pages that looked weak on average, but performed brilliantly for a specific segment that actually drove most of the profit.
When you only stare at the overall number, you risk fixing something that was already working for your best customers.
Mistake 5: Ignoring qualitative data
Early on, I lived almost entirely in analytics. Pageviews, bounce rates, conversion rates. Numbers felt objective and safe. Asking visitors for feedback felt messy.
Then I started reading on-site surveys, customer interviews, and support tickets with a CRO lens. The tests got better almost overnight.
People were literally telling us what confused them, what they did not trust, and what they wished they could do.
Skipping qualitative data is based on the misconception that CRO is purely mathematical. In reality, it is about human decision making, which is emotional, social, and sometimes irrational. Quantitative data tells you where the problem is. Qualitative data tells you why.
Mistake 6: Optimizing for clicks, not customers
It is very easy to fall into the trap of optimizing for the metric you see most often. Click through rates, form submissions, trial signups. Those are all meaningful, but they are still steps on the way to value.
If you celebrate every small uptick without checking what happens downstream, you can accidentally attract the wrong leads, increase churn and fill your pipeline with people who never buy.
A pop up that triples email signups is not a real impact maker if those subscribers never open or click your emails.
That alignment starts with a solid demand generation strategy by UnboundIA, so the traffic entering your funnel is already the right fit.
CRO works best when it aligns surface metrics with the true outcome you care about, such as revenue, retention, or qualified leads.
How to Measure Success (Metrics + Tools)
Once you start taking CRO seriously, success needs a clear scoreboard. Otherwise how would you know if your strategies are working or not?
Here are the numbers I like to keep in front of me:
Conversion rate: The classic one. Conversion rate = conversions ÷ visitors × 100. If 50 people buy out of 1,000 visitors, that is a 5 percent conversion rate.
Micro conversions: Not everyone buys on day one. Track smaller yes moments too like newsletter signups, free trial starts, account creations, add to cart clicks.
Revenue per visitor (RPV): This ties CRO directly to money. RPV = total revenue ÷ total visitors. It lets you see whether a new variation attracts more valuable customers, not just more clicks.
Average order value (AOV): Helpful when you test bundles, cross sells or pricing changes. Sometimes the goal is not more customers, but better quality orders.
Funnel drop offs: Watch how many people move from step to step, like from product page to cart, cart to checkout, checkout to payment. This is where the real leaks usually hide.
Device and channel performance: Always split results by mobile and desktop, and by traffic source. A page that looks average overall may be a star performer for one segment and a disaster for another.
I like to review these numbers weekly, then zoom in on outliers. That is usually where my best test ideas come from.
Tools that make tracking easier
You do not need a giant stack to measure CRO, but the right tools remove a lot of the work.
Google Analytics 4 (GA4): This is my base layer for traffic, events and attribution. GA4 shows where visitors come from, what they do and where they drop off. I set up key events for purchases, signups, demo requests and treat them as the main conversion goals.
Hotjar or similar behavior tools: Heatmaps, scroll maps and session recordings turn numbers into behavior. You can literally watch people rage click a tiny button or abandon a form at the same field. That kind of insight is valuable when you plan tests.
Fibr AI for AI first CRO: Fibr AI is an AI powered CRO platform that sits on top of your site and helps you optimize much faster. It analyzes user behavior, runs audits, and tells you what needs to be improved. You can then use a no code WYSIWYG editor to push changes live without waiting on developers.
My own workflow often looks like this - GA4 to see the what, Hotjar to understand the why, then Fibr AI to suggest, test and ship improvements. That combination keeps me much closer to real outcomes.
How AI and Automation Are Simplifying CRO
When I first learned CRO, a lot of my time went into manual chores. Exporting CSVs, building pivot tables, trying to spot patterns by eye. Today, AI tools change that completely.
AI powered CRO tools can scan thousands of sessions, segments and pages much faster than a human. Platforms like Fibr AI use automated insights, predictive analytics and personalized recommendations to highlight where you are losing people and what you should test next.
Real time personalization at scale
The real magic appears when AI starts shaping the experience itself.
Fibr AI runs this work in real time as one connected system.
Testing different versions of your pages
Personalizing content based on who is visiting
Monitoring site health and performance
Together they adjust what people see, spot problems early and push the site toward what actually converts, without constant hand holding from a human team.
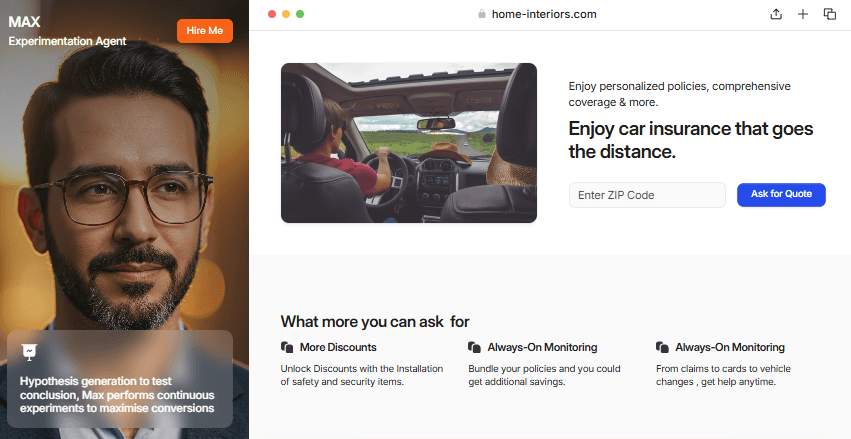
That means a visitor arriving from a specific ad can land on a version of the page that mirrors the ad message, while another segment sees a variation tuned to their intent. The underlying logic runs automatically, which would be almost impossible to manage by hand at any real scale
Faster, smarter experimentation
AI also changes how we run tests.
Instead of manually writing every variant, assigning traffic splits and monitoring results, an AI first tool can
Suggest test ideas based on patterns it sees in the data
Spin up multiple variants of copy, layout or offers
Allocate more traffic to promising versions as evidence builds
Call a winner and help you roll it out across campaigns
Fibr AI leans into this with AI powered A/B testing, landing page scaling and bulk content updates, aimed at increasing conversion rates while keeping customer acquisition costs in check.

For me, the biggest shift is mental. When AI and automation handle the tedious parts of CRO, I can spend my time on questions that these systems can’t handle, like
Does this offer truly match what our best customers want?
Are we positioning the product in a way that feels honest and compelling?
Which audience deserves a dedicated flow or landing page?
Surely, you wouldn’t want a computer to brainstorm these for you.
In practical terms, Fibr AI watches behavior, suggests tests, personalizes experiences, and keeps an eye on site health. I still decide the strategy and guardrails, but I am no longer trying to do everything by hand.
That is how AI and automation simplify CRO. They do not replace the need for good judgment and empathy for your visitors. They make it much easier to apply that judgment at scale.
CRO Checklist for Companies
Use this checklist as a simple control panel for your optimization efforts.
To use this,
Go through each item and mark it as Yes, In progress, or No
Anything in the No column becomes a task for your next sprint
Revisit the checklist every quarter to see how your CRO maturity is improving
You do not have to complete everything at once. Use it to stay focused on the right next step instead of chasing random tactics.
Strategy and Goals
Primary conversion goal is clearly defined for each key page
(purchase, demo request, signup, lead form, etc.)Secondary or micro conversions are defined
(add to cart, scroll depth, video plays, email captures)You know your current baseline metrics
(conversion rate, revenue per visitor, average order value)You have a simple, written CRO plan for the next 1 to 3 months
Leadership understands that CRO is ongoing, not a one time project
Data and Tracking
Analytics platform is correctly installed on all pages
Key events and goals are set up and verified
Traffic is segmented by device, channel, and key locations
Funnel reports show drop offs at each step
UTM tracking is used consistently for campaigns
Note: If tracking is broken or incomplete, pause big tests and fix this first. CRO decisions rely on trustworthy data.
User Research and Feedback
On site or in product surveys collect feedback from real visitors
You review support tickets and sales calls for objections and friction
You have a basic process for customer interviews or user tests
You maintain a list of recurring themes in user feedback
Qualitative insights are linked to specific test ideas
Page and Funnel Experience
Each key page has one primary call to action
Content is scannable
(clear headings, short paragraphs, obvious bullets)Forms only ask for essential fields
Social proof and trust signals appear near the decision point
(testimonials, reviews, guarantees, policies)Mobile experience is reviewed separately from desktop
Checkout or sign up flow is as short and simple as possible
Testing and Experimentation
You keep a shared backlog of test ideas
Each test has a clear hypothesis and success metric
You run A B tests or similar experiments on important changes
Test results are documented, even when they lose or are inconclusive
Wins are implemented permanently and rolled out to similar page.
To use this section, aim for at least one meaningful experiment in each cycle, even if it is small.
Speed, Performance, and Reliability
Key pages are checked for load times on mobile and desktop
Large images and scripts are optimized
Core pages work correctly in all major browsers
Broken links and 404 pages are monitored and fixed
You have alerts or checks in place for serious site issues
Personalization and Segmentation
High value segments are identified
(for example repeat buyers, a key industry, or a key country)Messaging or offers are tailored for at least one priority segment
Landing pages align closely with ad groups and search intent
Email and retargeting flows exist for non buyers and abandoners
If you already use analytics and basic behavior tools, adding Fibr AI or a similar platform can turn this checklist into a living system.
It can highlight issues, suggest tests, and help you ship changes much faster, while you stay focused on strategy and customer understanding.
A Final Thought on CRO
The longer I work with CRO, the more I see it as a quiet act of respect. You are not trying to trick visitors into doing something they do not want to do. You are removing friction so that the right people can say yes to something that genuinely helps them.
That small mindset shift changes everything.
Headlines become clearer. Forms become shorter. Offers become more honest. You stop chasing vanity traffic and start building a business that feels good to grow.
AI and automation simply amplify that mindset. They help you notice patterns faster, run smarter tests, and personalize experiences at a scale that would be impossible by hand.
If you want help with that, Fibr AI is worth a serious look. It can sit on top of your existing tech stack, highlight where you are leaking conversions, and help you test and ship better experiences without drowning in manual work.
FAQs
How often should I run CRO tests?
I like to think in cycles. For most teams, aiming for at least one meaningful test per key funnel each month is realistic. Larger sites with more traffic can test faster. The important part is consistency and documenting every result.
What is a good conversion rate?
It depends on your industry, product, and traffic source. Many ecommerce sites sit around 2 to 3 percent, while high intent landing pages can convert in the double digits. Instead of going for a universal benchmark, focus on improving your own baseline by a few percentage points at a time.
How is CRO different from SEO and paid ads?
SEO and paid ads bring people in and CRO decides what happens after they arrive. You can think of traffic channels as the volume dial and CRO as the tuning knob that makes each visitor more valuable.
Does CRO still work if I have low traffic?
Yes, but you will lean more on qualitative research, usability tests, and bigger changes rather than tiny A/B tests. You can still improve your pages through structured experiments, even if the stats take longer to reach significance.
How can Fibr AI help with CRO in practice?
Fibr AI connects to your site and analytics, flags issues in your funnels, suggests test ideas, and lets you create and ship changes with a no code editor.
It uses AI to handle much of the analysis and setup, while you stay focused on strategy, messaging, and knowing your customers.




Pritam Roy
Co-Founder @ Fibr AI
Pritam Roy, the Co-founder of Fibr, is a seasoned entrepreneur with a passion for product development and AI. A graduate of IIT Bombay, Pritam's expertise lies in leveraging technology to create innovative solutions. As a second-time founder, he brings invaluable experience to Fibr, driving the company towards its mission of redefining digital interactions through AI.
Table of Content
Read summarized version with
Introduction
Guilty…I used to be one of those who obsess over traffic charts, those innocent ones watching those little blue lines climb and feeling sure that more visitors meant more sales.
Then I had a month where traffic grew by 40% and revenue barely moved.
I felt like I was throwing a huge party and most people left before they even reached the bar. That was my wake up call.
That was when I stopped running after visits and started optimizing my sites and pages for conversions.
But conversions are hard. According to Statista, the average conversion rate across all ecommerce sites is under 2 percent, which means more than 98 out of 100 visitors typically leave without taking any action. Bummer!
So it was clear…I did not need more people at the door, I needed more people saying yes. After all, traffic is attention, not income.
Conversion rate optimization, or CRO, is how we solve this.
And that’s what we are dissecting today: the A-to-Z of proper conversion rate optimization. Let’s begin
What is CRO, and Why Should You Care?
After I learned the hard way that traffic does not automatically equal sales, I went looking for what I was doing wrong. My mistake was not paying enough attention to Conversion Rate Optimization.
CRO is the structured process of improving your website or funnel so a higher percentage of visitors complete the actions that matter to your business. That could be buying a product, filling out a form, booking a call or demo, signing up for your newsletter, creating an account or starting a free trial.
To put it simply, traffic gets people in the room and CRO helps them feel comfortable enough to say yes.
To do that, CRO usually includes things like
Looking at analytics, heatmaps, and recordings to see where people get stuck
Talking to customers or running surveys to understand what they need
Testing different headlines, layouts, and offers instead of guessing
Why should you care?
When you look at the numbers, you’ll find it impossible to see CRO as an option.
Recent benchmarks will tell you that the average ecommerce conversion rate is around 2.58 percent, which means roughly 97 out of 100 visitors leave without buying anything. That is a lot of unrealized potential sitting in your analytics.
You also are not alone if your current results feel underwhelming. Studies show only about 22 percent of businesses are satisfied with their conversion rates, so most teams are still not getting to the full potential of their business.
On top of that, research based on Econsultancy data found that for every 92 dollars spent acquiring customers, only 1 dollar is spent converting them.
All of this means that if you take CRO seriously, you are working where most competitors are not. You are turning existing traffic into revenue. Now, let’s see how you can do that in practice…
From Theory to Practice: CRO Implementation Framework
Look, you can read about CRO theory all day long, but at some point you need to roll up your sleeves and start optimizing. The good news is that there's a proven framework that takes the confusion out of the process.
Let's walk through the five-step framework that successful companies use to systematically improve their conversion rates
Step 1: Audit and baseline
Before you change anything, you need to know where you stand. Seems obvious, right?
Yet you'd be surprised how many teams skip this step and jump straight into testing random ideas.
Your audit should dig into several key areas:
Analytics deep dive: First, find out where are visitors dropping off, which pages have terrible bounce rates, and what's your current conversion rate by traffic source, device, and landing page.
Technical performance: Figure out how fast do your pages load, are there console errors, and if everything work on mobile.
User experience review: Click through your own site like a first-time visitor. Where do you get confused? What questions go unanswered?
Competitive analysis: Find out what similar companies are doing (Not to copy them blindly, but to understand market expectations)
If you don't know you're converting at 2.3% right now, how will you know if you've improved to 2.8% later? Document everything.
Step 2: Hypothesis and prioritization
Now that you know what's broken, resist the urge to fix everything at once. You need a system for deciding what to handle first.
Start by forming hypotheses based on your audit findings. A good hypothesis follows this format:
If we [make this change] for [this audience], then [this metric] will improve because [this reason].
For example:
"If we add trust badges to the checkout page for first-time visitors, then cart abandonment will decrease because users will feel more confident entering payment information."
"If we simplify our pricing page from five tiers to three tiers for small business visitors, then conversions will increase because decision paralysis will be reduced."
Notice how specific these are? That's what makes them testable.
Once you've got a list of hypotheses, you need to prioritize them. Most teams use some variation of the ICE framework:
Impact: How much will this make an impact? (1-10)
Confidence: How sure are you this will work? (1-10)
Ease: How simple is it to implement? (1-10)
Add up the scores, and tackle the highest-scoring items first. This keeps you focused on changes that could matter rather than spending weeks tweaking button colors that won't impact revenue.
Step 3: Test you design with A/B and multivariate tests
Time to actually run some experiments. There are two main types you'll use:
A/B testing is the simpler approach. You create two versions (A and B) and split your traffic between them to see which performs better. Maybe version A has your current headline and version B has a new one. Clean, straightforward, easy to analyze.
Multivariate testing is more complex. You're testing multiple changes simultaneously to see how they interact.
For instance, you might test three different headlines, two different images, and two different CTA buttons all at once. That's 12 different combinations (3 x 2 x 2). This requires significantly more traffic to reach statistical significance, but it can uncover insights about how elements work together.
But what makes a good test?
Single variable focus (for A/B tests): Change one thing at a time so you know what drove the results
Sufficient sample size: You need enough visitors to reach statistical significance, usually at least a few thousand conversions
Proper test duration: Run tests for at least one full business cycle (usually 2-4 weeks) to account for day-of-week variations
Clean implementation: Make sure your testing tool is properly installed and not causing flickering or page load issues
This is where modern tools can really accelerate your testing velocity. Platforms like Fibr AI let you run multiple personalized experiments simultaneously without needing a developer.
Instead of spending weeks building test variations manually, you can create personalized landing pages that automatically match your ad messaging, keywords, or audience segments, then test them against each other to see which approaches convert best.
Step 4: Analyze and iterate
Your test finished running. Now what? This is where a lot of teams fumble. They look at the conversion rate of A versus B, declare a winner, and move on. But there's so much more to learn if you dig deeper.
Ask these questions:
Did we reach statistical significance? A 95% confidence level is the standard. Anything less and you're making decisions based on false assumptions.
How did different segments perform? Maybe version B won overall, but version A worked better for mobile users or first-time visitors
What secondary metrics changed? Did the winning version also improve time on page, reduce bounce rate, or affect average order value?
What did we learn about user behavior? Even losing tests teach you something about what resonates with your audience
Document your findings. Seriously, write them down. Six months from now when you're testing something similar, you'll want to reference what you learned.
Then comes the iteration part. Winning tests don't mean you're done—they mean you've found a new baseline to improve upon. If simplifying your headline worked, what if you simplified your entire page layout? If adding trust badges helped, what if you added more specific ones? Keep pushing.
Step 5: Scale your winning experiments
I will assume at this point, you've found something that works. Great! Now don't let that win sit on a single landing page.
The final step is taking your successful tests and scaling them across your entire website, marketing campaigns, and customer touchpoints.
This might mean
Applying the winning element to similar pages: If a new headline format worked on your pricing page, test it on your product pages too
Building it into your templates: Make your winning patterns the new default for future pages
Sharing insights across teams: If your landing page team discovered something, tell your email team; they might be able to use it too
Creating a strategy: Document what works so new team members can benefit from your institutional knowledge
Believe it or not, the companies that see exponential growth from CRO aren't the ones that run one test and call it a day. They're the ones that systematically scale their wins and create a culture of continuous optimization.
Modern AI-powered platforms are making this scaling process much faster. With Fibr AI, once you've identified a winning approach — say, matching your landing page headlines to your ad copy — you can automatically apply that formula across hundreds of ads and landing pages at once.
What used to take months of manual work now happens in minutes. This means you can scale winning experiments across entire campaigns without the bottleneck of creating each variation by hand.
Real world success stories of CRO
It is one thing to talk about CRO in theory. It feels very different when you see what a single thoughtful experiment can do in the real world. Here are a few stories I like to keep in mind
Obama 2008
During the 2008 presidential campaign, the Obama team tested different images and button text on a simple splash page that asked visitors to join the email list. The original version converted 8.26 percent of visitors. The winning variation, with a more reassuring family photo and a softer call to action, converted 11.6 percent.
That lift of 40.6 percent in sign ups translated into roughly 2.8 million extra email addresses and an estimated 60 million dollars in additional donations.
What I love about this example is how ordinary it looks. No flashy redesign. Just careful testing of what people saw and what you asked them to do first.
Nature Air
Costa Rican airline Nature Air had a set of landing pages that were getting traffic but not many bookings. After watching user behavior, the team realised the call to action was visually buried.
They tested a new layout that brought the main booking button into a much more prominent position, with clearer copy around it. The result was dramatic. Conversions jumped from 2.78 percent to 19 percent, which is a 591 percent increase in conversion rate.
This story always reminds me that visitors cannot click what they do not notice. Good CRO often starts with simple questions about visibility and clarity, not complex psychological tricks.
TruckersReport
TruckersReport, a site that connects truck drivers with jobs and resources, ran a series of A B tests on a key lead generation page. They experimented with the headline, the structure of the form and the way benefits were presented.
By iterating through several rounds, they ended up with a version that increased conversions significantly compared with the original.
What stands out here is the process. There was no single magic tweak. The win came from treating the page like a living experiment and letting each round of data inform the next change
Mistakes to Avoid (Based on Common Misconceptions)
When I first got into CRO, I did not lack effort. I lacked focus. I chased every best practice I saw on marketing blogs and wondered why nothing really moved. Looking back, most of my mistakes came from very common misconceptions about what CRO actually is.
Here are the big ones I see over and over again, in my own work and in clients’ accounts
Mistake 1: Thinking more traffic is the fix
Ah…the classic one. Traffic feels exciting, because it is visible.
You see spikes in your analytics and it feels like progress. The reality is that if your page does not convert, pouring more visitors into it only produces more exits.
This mindset leads to overspending on ads, neglecting landing pages and funnels and blaming channels instead of fixing the offer or experience
Once I changed the question from How do I get more people here to How do I help the right people say yes, decisions became a lot clearer.
You do it by deeply understanding who your best visitors are, what they care about, and what is stopping them from acting, then reshaping your pages around those needs. In practice, that means clearer messaging, stronger proof, smoother paths to action and constant testing to see what truly helps them say yes.
Mistake 2: Copying competitors and big brands
I used to keep swipe files filled with screenshots from big-name websites. If a famous SaaS brand used a certain layout, I assumed it would work for every other product under the sun.
The problem is you do not see their data, their audience, or their tests. You only see the current winner for their specific context. When you copy them, you are not copying an insight. You are copying a guess.
In practice, this leads to
Headlines that sound nice but mean nothing to your audience
Funnel steps that slow people down instead of helping them decide
Complex pages that impress internal teams more than real visitors
Inspiration is helpful. Blind imitation is expensive.
Mistake 3: Testing too many things at once
Once you understand that testing is powerful, the temptation is to redesign entire pages in one go. New layout, new copy, new images, new pricing display, all in a single A/B test.
The issue is that even if the new version wins, you have no idea why. Was it the shorter form. The clearer headline. The simplified navigation. You gain a win, but lose a lesson.
Good CRO respects causality. Small, focused tests feel slower but they create a library of insights you can reuse across pages, campaigns, and even products.
Mistake 4: Obsessing over averages and ignoring segments
Another misconception is that there is one conversion rate that tells the whole story. In reality, averages hide more than they reveal.
Here are things I now look at separately
Mobile versus desktop
New visitors versus returning visitors
Traffic by channel (search, social, email, direct, referrals)
Key countries or regions
I have seen pages that looked weak on average, but performed brilliantly for a specific segment that actually drove most of the profit.
When you only stare at the overall number, you risk fixing something that was already working for your best customers.
Mistake 5: Ignoring qualitative data
Early on, I lived almost entirely in analytics. Pageviews, bounce rates, conversion rates. Numbers felt objective and safe. Asking visitors for feedback felt messy.
Then I started reading on-site surveys, customer interviews, and support tickets with a CRO lens. The tests got better almost overnight.
People were literally telling us what confused them, what they did not trust, and what they wished they could do.
Skipping qualitative data is based on the misconception that CRO is purely mathematical. In reality, it is about human decision making, which is emotional, social, and sometimes irrational. Quantitative data tells you where the problem is. Qualitative data tells you why.
Mistake 6: Optimizing for clicks, not customers
It is very easy to fall into the trap of optimizing for the metric you see most often. Click through rates, form submissions, trial signups. Those are all meaningful, but they are still steps on the way to value.
If you celebrate every small uptick without checking what happens downstream, you can accidentally attract the wrong leads, increase churn and fill your pipeline with people who never buy.
A pop up that triples email signups is not a real impact maker if those subscribers never open or click your emails.
That alignment starts with a solid demand generation strategy by UnboundIA, so the traffic entering your funnel is already the right fit.
CRO works best when it aligns surface metrics with the true outcome you care about, such as revenue, retention, or qualified leads.
How to Measure Success (Metrics + Tools)
Once you start taking CRO seriously, success needs a clear scoreboard. Otherwise how would you know if your strategies are working or not?
Here are the numbers I like to keep in front of me:
Conversion rate: The classic one. Conversion rate = conversions ÷ visitors × 100. If 50 people buy out of 1,000 visitors, that is a 5 percent conversion rate.
Micro conversions: Not everyone buys on day one. Track smaller yes moments too like newsletter signups, free trial starts, account creations, add to cart clicks.
Revenue per visitor (RPV): This ties CRO directly to money. RPV = total revenue ÷ total visitors. It lets you see whether a new variation attracts more valuable customers, not just more clicks.
Average order value (AOV): Helpful when you test bundles, cross sells or pricing changes. Sometimes the goal is not more customers, but better quality orders.
Funnel drop offs: Watch how many people move from step to step, like from product page to cart, cart to checkout, checkout to payment. This is where the real leaks usually hide.
Device and channel performance: Always split results by mobile and desktop, and by traffic source. A page that looks average overall may be a star performer for one segment and a disaster for another.
I like to review these numbers weekly, then zoom in on outliers. That is usually where my best test ideas come from.
Tools that make tracking easier
You do not need a giant stack to measure CRO, but the right tools remove a lot of the work.
Google Analytics 4 (GA4): This is my base layer for traffic, events and attribution. GA4 shows where visitors come from, what they do and where they drop off. I set up key events for purchases, signups, demo requests and treat them as the main conversion goals.
Hotjar or similar behavior tools: Heatmaps, scroll maps and session recordings turn numbers into behavior. You can literally watch people rage click a tiny button or abandon a form at the same field. That kind of insight is valuable when you plan tests.
Fibr AI for AI first CRO: Fibr AI is an AI powered CRO platform that sits on top of your site and helps you optimize much faster. It analyzes user behavior, runs audits, and tells you what needs to be improved. You can then use a no code WYSIWYG editor to push changes live without waiting on developers.
My own workflow often looks like this - GA4 to see the what, Hotjar to understand the why, then Fibr AI to suggest, test and ship improvements. That combination keeps me much closer to real outcomes.
How AI and Automation Are Simplifying CRO
When I first learned CRO, a lot of my time went into manual chores. Exporting CSVs, building pivot tables, trying to spot patterns by eye. Today, AI tools change that completely.
AI powered CRO tools can scan thousands of sessions, segments and pages much faster than a human. Platforms like Fibr AI use automated insights, predictive analytics and personalized recommendations to highlight where you are losing people and what you should test next.
Real time personalization at scale
The real magic appears when AI starts shaping the experience itself.
Fibr AI runs this work in real time as one connected system.
Testing different versions of your pages
Personalizing content based on who is visiting
Monitoring site health and performance
Together they adjust what people see, spot problems early and push the site toward what actually converts, without constant hand holding from a human team.
That means a visitor arriving from a specific ad can land on a version of the page that mirrors the ad message, while another segment sees a variation tuned to their intent. The underlying logic runs automatically, which would be almost impossible to manage by hand at any real scale
Faster, smarter experimentation
AI also changes how we run tests.
Instead of manually writing every variant, assigning traffic splits and monitoring results, an AI first tool can
Suggest test ideas based on patterns it sees in the data
Spin up multiple variants of copy, layout or offers
Allocate more traffic to promising versions as evidence builds
Call a winner and help you roll it out across campaigns
Fibr AI leans into this with AI powered A/B testing, landing page scaling and bulk content updates, aimed at increasing conversion rates while keeping customer acquisition costs in check.
For me, the biggest shift is mental. When AI and automation handle the tedious parts of CRO, I can spend my time on questions that these systems can’t handle, like
Does this offer truly match what our best customers want?
Are we positioning the product in a way that feels honest and compelling?
Which audience deserves a dedicated flow or landing page?
Surely, you wouldn’t want a computer to brainstorm these for you.
In practical terms, Fibr AI watches behavior, suggests tests, personalizes experiences, and keeps an eye on site health. I still decide the strategy and guardrails, but I am no longer trying to do everything by hand.
That is how AI and automation simplify CRO. They do not replace the need for good judgment and empathy for your visitors. They make it much easier to apply that judgment at scale.
CRO Checklist for Companies
Use this checklist as a simple control panel for your optimization efforts.
To use this,
Go through each item and mark it as Yes, In progress, or No
Anything in the No column becomes a task for your next sprint
Revisit the checklist every quarter to see how your CRO maturity is improving
You do not have to complete everything at once. Use it to stay focused on the right next step instead of chasing random tactics.
Strategy and Goals
Primary conversion goal is clearly defined for each key page
(purchase, demo request, signup, lead form, etc.)Secondary or micro conversions are defined
(add to cart, scroll depth, video plays, email captures)You know your current baseline metrics
(conversion rate, revenue per visitor, average order value)You have a simple, written CRO plan for the next 1 to 3 months
Leadership understands that CRO is ongoing, not a one time project
Data and Tracking
Analytics platform is correctly installed on all pages
Key events and goals are set up and verified
Traffic is segmented by device, channel, and key locations
Funnel reports show drop offs at each step
UTM tracking is used consistently for campaigns
Note: If tracking is broken or incomplete, pause big tests and fix this first. CRO decisions rely on trustworthy data.
User Research and Feedback
On site or in product surveys collect feedback from real visitors
You review support tickets and sales calls for objections and friction
You have a basic process for customer interviews or user tests
You maintain a list of recurring themes in user feedback
Qualitative insights are linked to specific test ideas
Page and Funnel Experience
Each key page has one primary call to action
Content is scannable
(clear headings, short paragraphs, obvious bullets)Forms only ask for essential fields
Social proof and trust signals appear near the decision point
(testimonials, reviews, guarantees, policies)Mobile experience is reviewed separately from desktop
Checkout or sign up flow is as short and simple as possible
Testing and Experimentation
You keep a shared backlog of test ideas
Each test has a clear hypothesis and success metric
You run A B tests or similar experiments on important changes
Test results are documented, even when they lose or are inconclusive
Wins are implemented permanently and rolled out to similar page.
To use this section, aim for at least one meaningful experiment in each cycle, even if it is small.
Speed, Performance, and Reliability
Key pages are checked for load times on mobile and desktop
Large images and scripts are optimized
Core pages work correctly in all major browsers
Broken links and 404 pages are monitored and fixed
You have alerts or checks in place for serious site issues
Personalization and Segmentation
High value segments are identified
(for example repeat buyers, a key industry, or a key country)Messaging or offers are tailored for at least one priority segment
Landing pages align closely with ad groups and search intent
Email and retargeting flows exist for non buyers and abandoners
If you already use analytics and basic behavior tools, adding Fibr AI or a similar platform can turn this checklist into a living system.
It can highlight issues, suggest tests, and help you ship changes much faster, while you stay focused on strategy and customer understanding.
A Final Thought on CRO
The longer I work with CRO, the more I see it as a quiet act of respect. You are not trying to trick visitors into doing something they do not want to do. You are removing friction so that the right people can say yes to something that genuinely helps them.
That small mindset shift changes everything.
Headlines become clearer. Forms become shorter. Offers become more honest. You stop chasing vanity traffic and start building a business that feels good to grow.
AI and automation simply amplify that mindset. They help you notice patterns faster, run smarter tests, and personalize experiences at a scale that would be impossible by hand.
If you want help with that, Fibr AI is worth a serious look. It can sit on top of your existing tech stack, highlight where you are leaking conversions, and help you test and ship better experiences without drowning in manual work.
FAQs
How often should I run CRO tests?
I like to think in cycles. For most teams, aiming for at least one meaningful test per key funnel each month is realistic. Larger sites with more traffic can test faster. The important part is consistency and documenting every result.
What is a good conversion rate?
It depends on your industry, product, and traffic source. Many ecommerce sites sit around 2 to 3 percent, while high intent landing pages can convert in the double digits. Instead of going for a universal benchmark, focus on improving your own baseline by a few percentage points at a time.
How is CRO different from SEO and paid ads?
SEO and paid ads bring people in and CRO decides what happens after they arrive. You can think of traffic channels as the volume dial and CRO as the tuning knob that makes each visitor more valuable.
Does CRO still work if I have low traffic?
Yes, but you will lean more on qualitative research, usability tests, and bigger changes rather than tiny A/B tests. You can still improve your pages through structured experiments, even if the stats take longer to reach significance.
How can Fibr AI help with CRO in practice?
Fibr AI connects to your site and analytics, flags issues in your funnels, suggests test ideas, and lets you create and ship changes with a no code editor.
It uses AI to handle much of the analysis and setup, while you stay focused on strategy, messaging, and knowing your customers.
Pritam Roy
Co-Founder @ Fibr AI
Pritam Roy, the Co-founder of Fibr, is a seasoned entrepreneur with a passion for product development and AI. A graduate of IIT Bombay, Pritam's expertise lies in leveraging technology to create innovative solutions. As a second-time founder, he brings invaluable experience to Fibr, driving the company towards its mission of redefining digital interactions through AI.



Is your website starting every visit from zero?
Is your website starting every visit from zero?
Is your website starting every visit from zero?
Fibr gives your website the intelligence it needs right from the start
Fibr AI gives your website the
intelligence it needs right from the start