
Pritam Roy
Landing pages, quite simply the gateway to your brand, are critical components of your sales funnel. They can make or break your conversion rates and significantly impact your customer journey.
After all, if a user lands on your page and doesn’t find what they were promised, rest assured, they’re bouncing off. In other words, ensuring your landing pages are functioning at their best is non-negotiable.
But this is easier said than done. Optimizing landing pages means keeping an eye on a number of factors, from promotion strategies to user experience.
If you find yourself pulling your hair out, unsure of which side is up in this dynamic marketing world, you’re in the right place.
Here, we uncover insights into the latest trends and discuss interesting future predictions that can help you optimize your landing page today while making it ready for tomorrow.
Key Metrics to Monitor for Landing Page Performance Statistics
Before we dive into our top 36 landing page statistics, here are some metrics you should track periodically to ascertain the success of your landing pages.
1. Conversion Rate
This is the percentage of visitors that took a desired action (signed up for a newsletter, made a purchase, etc.) on your landing page. The formula to calculate this is:
Number of Conversions/Total number of visitors x 100 = Conversion Rate
Conversion rate tracking is essential for several reasons:
Helps you recognize which landing pages deserve more budget, resources, and time
Allows you to ascertain the audience you need to cater to
Helps optimize existing landing pages
Helps identify why a customer landed on the page and took the desired action
If you’re wondering what is a good conversion rate for a landing page, the answer is 6.6%. However, this landing page statistic differs with industry. We will be discussing this ahead.
2. Bounce Rate
This refers to the percentage of users who reach your landing page but leave it without taking any action. Naturally, you want to aim for a low bounce rate. You see, a higher bounce rate indicates that your ad campaign is working fine, but your landing page is not. The user reaches your landing page but, finding nothing of value, leaves without engaging with anything.
Simply put, your bounce indicates the response of the audience to your landing page.
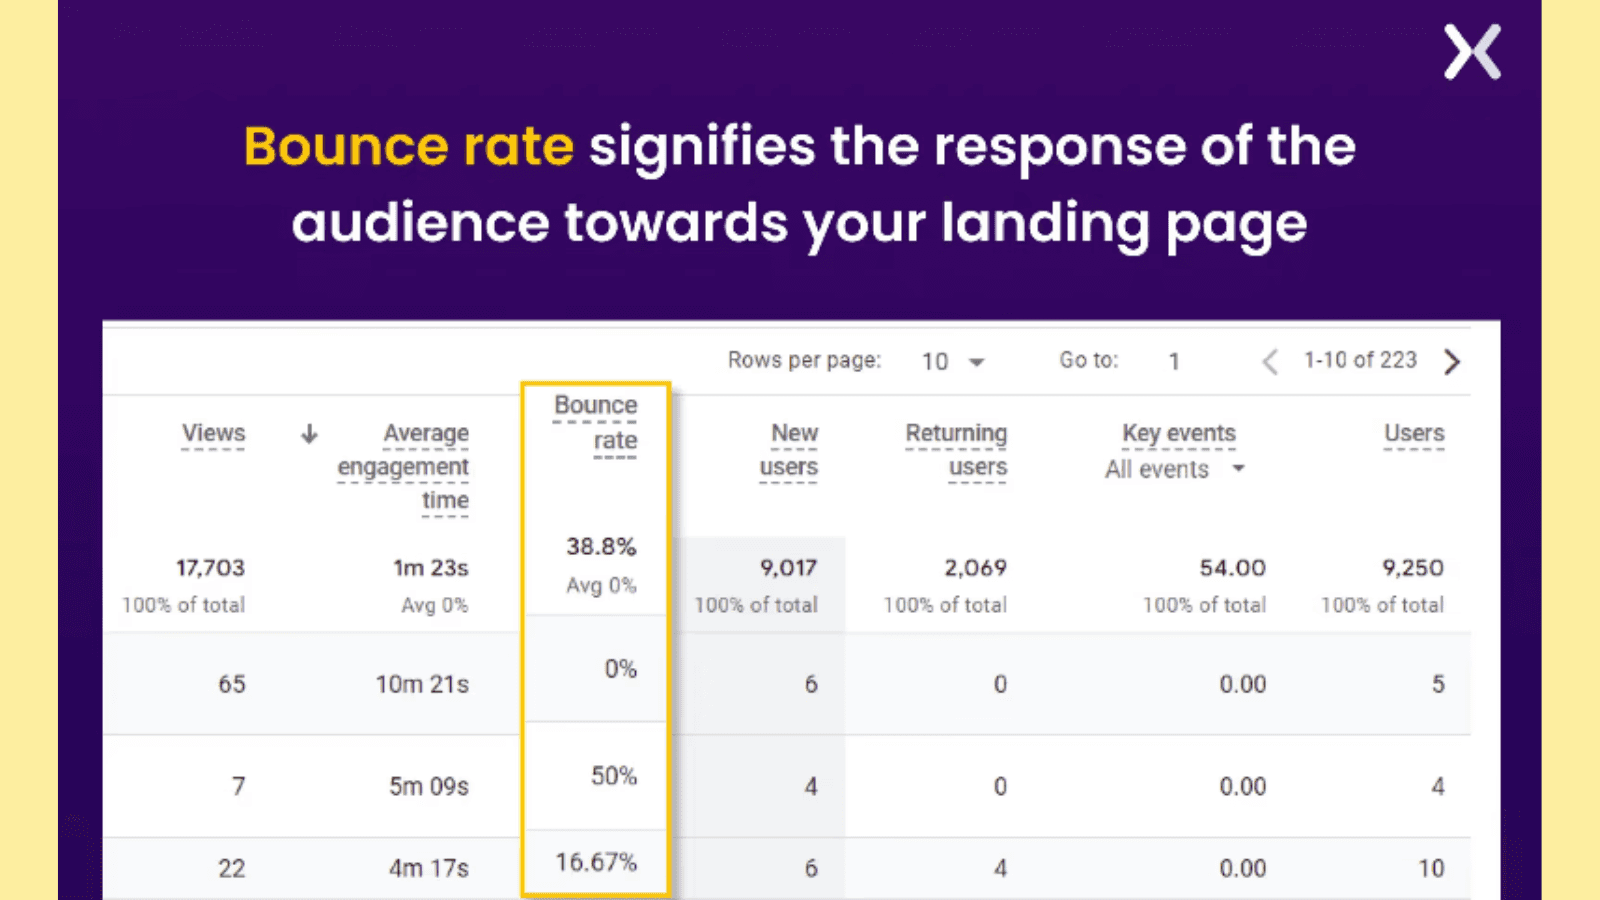
Monitoring your bounce rate helps you identify issues with your landing pages, learn why your audience is leaving, and prompt you to optimize it before you lose a chunk of visitors to a sub-par landing page.
It is also an indication of how effectively your offering convinces the audience of its value and helps you improve user engagement and conversion rates.
3. Average Time Spent on Page
It's important to track how much time users spend on your landing page. However, this metric is highly subjective since it directly depends on the kind of landing page you have. In other words, a shorter duration of time spent on your landing page doesn’t necessarily point towards a sub-par landing page, just as a longer duration of time spent doesn’t confirm that the landing page is effective.
Let’s take an example. For instance, if your landing page is educational and offers information about the product, how to use it, features, and maintenance details, and the average time spent on the page is low, it can be a red flag. It could indicate that the page has insufficient information, overwhelming information, or even irrelevant information that puts out the visitor.
In such a case, a low average time should prompt you to analyze your content and optimize it for the landing page to perform better. Consider breaking down the information to make it more digestible and adding visual elements such as images, videos, banners, etc.
At the end of the day, the average time spent on the page must be correlated to the type of landing page for optimal results.
4. Page Views
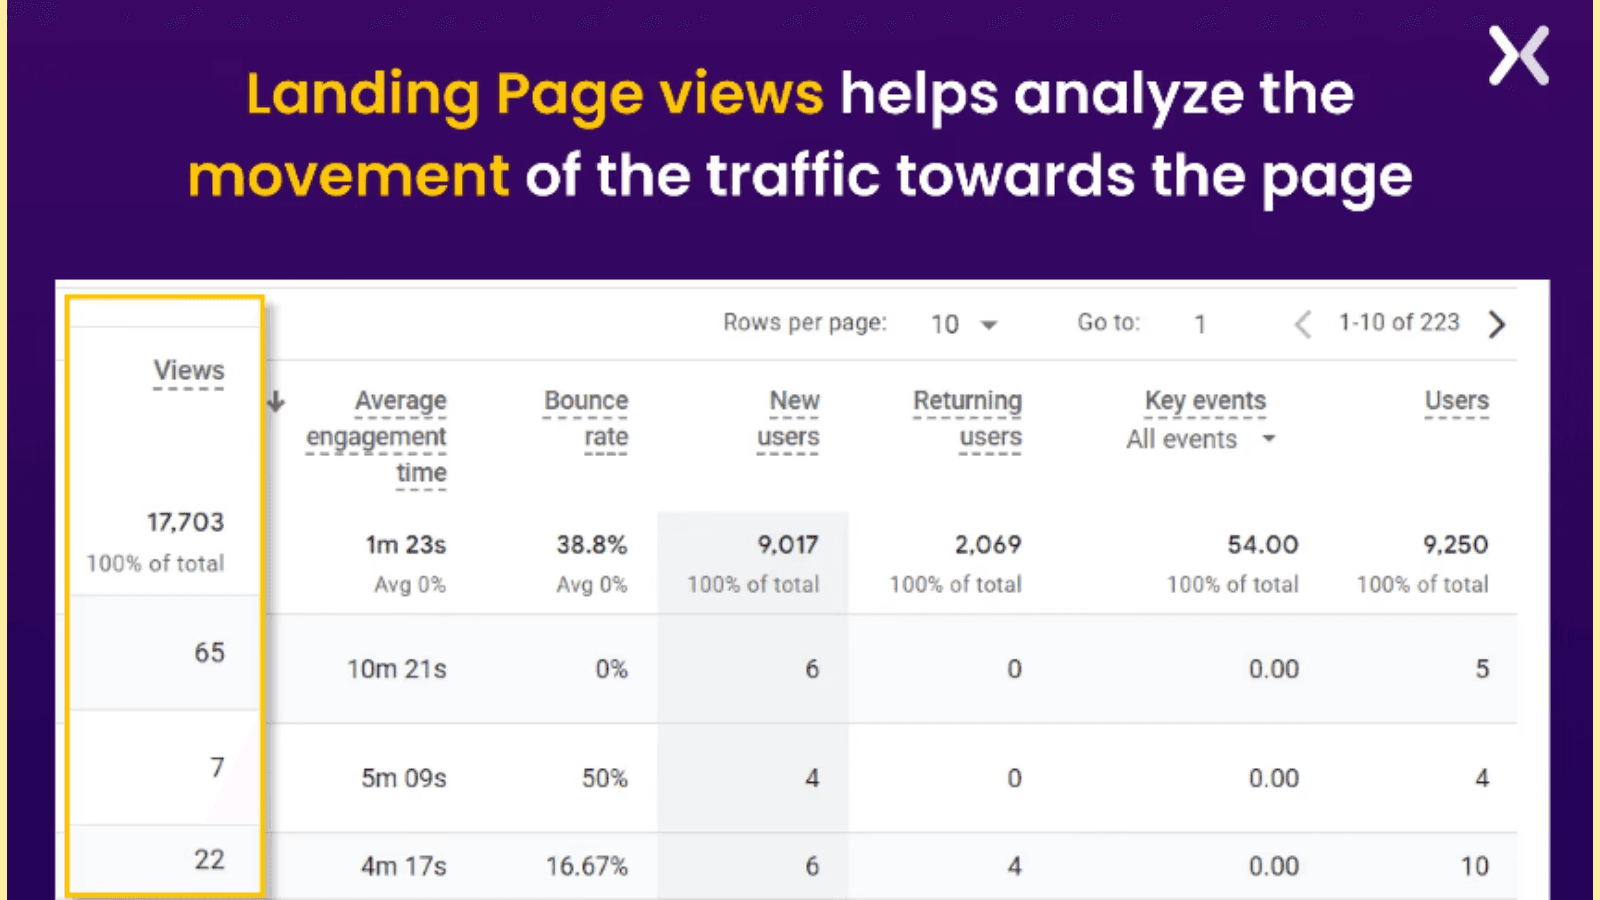
The next metric to track is your landing page view rate, which allows you to track which landing pages are achieving the most and the least amount of traffic. This handy metric allows you to identify which sources are responsible for the maximum landing page views. Further, if your page view rate is high but the landing page average conversion rate is low, it can prompt you to explore what’s deterring users from taking action.
Lastly, you can also analyze your page views to understand what caused more page views and the time of day that your audience is most likely to visit your landing page. Gaining this insight allows you to strategize your PPC ad campaigns more effectively.
5. Form Abandonment
This is a metric that measures the number of visitors who began filling out a form on your landing page but left the site without completing it, i.e., abandoning the form.
The reason behind abandoning the form could be that the form was too lengthy, it required too many personal details, it was unfriendly (it didn’t have a drop-down menu, it didn’t fit the device screen well, etc.).
If this metric is high, consider revisiting your form’s design. Analyze why you’re asking for the user’s information. For instance, if the form is to sign up for a newsletter, do you really need their mobile number in addition to their email address?
6. Return vs New Visitors
This measures the percentage of users that are new and the percentage that are returning. An often-overlooked metric, this can offer you significant insight into how effectively your landing page is engaging your visitors.
For this metric, new visitors will include users who are landing on your page for the first time, and return visitors will be ones who are well… returning to your site after having visited it previously. Your return vs new visitors metric can help you understand the performance of your landing page when analyzed with other metrics.
Let’s take an example. For instance, if you find new visitors spend more time on your landing page than returning ones, consider offering incentives such as special coupon codes to bring them back. Similarly, if returning visitors have a high bounce rate, consider tweaking the quality of your content to make it more appealing. You see, if users are returning, they want more. But if they hop off quickly, it means your content might be lacking.
Examine your landing page content to understand what improvements can reduce your bounce rate.
7. Sessions by Source
Sessions source refers to the pathway from where users visit your landing page. This can be Google, social media platforms, paid ads, affiliate marketing, and the like. Understanding where your users are coming from is essential to optimizing and improving the performance of your landing pages.
How? Well, by giving you insight into which channels are converting the most traffic. Once you know your top channels, you know where to allocate your ad spend and what to optimize your landing pages for. For instance, if you find Instagram is bringing your landing page the maximum visitors, and a chunk of them are converting, you can consider investing more in your Instagram ad campaigns.
Similarly, if you’re not getting your money’s worth of traffic from a specific channel, it can prompt you to drop campaigns on that and double down on those that are bringing in high buyer intent traffic.
8. Cost Per Conversion
Your ad budget is arguably one of the most crucial factors to consider when optimizing your landing page. Because of this, it's important to monitor how much you spend on acquiring a new lead. The Cost Per Conversion (CPC) metric does just that. The formula for this is:
Total cost of generating traffic/Total number of landing page conversions = Cost Per Conversion
Now, while we all want to drive the number of landing page conversions, we don’t want to do so while increasing our costs, too. Keeping an eye on our CPC allows us to ring the alarm bells in case costs rise and find a balance between our landing page’s average conversion rate and our ad spend.
Industry Benchmarks and What They Mean
Understanding the benchmark within your industry allows you to learn where the bar is. Once you have a standard to compare your numbers to, gauging whether your landing pages are doing well, setting conversion rate goals, and allocating budget becomes easier and more efficient.
Now, while the landing page average conversion rate is 6.6% as discussed previously, it fluctuates drastically across industries. Here’s a look at the different landing page conversion rates for each industry:
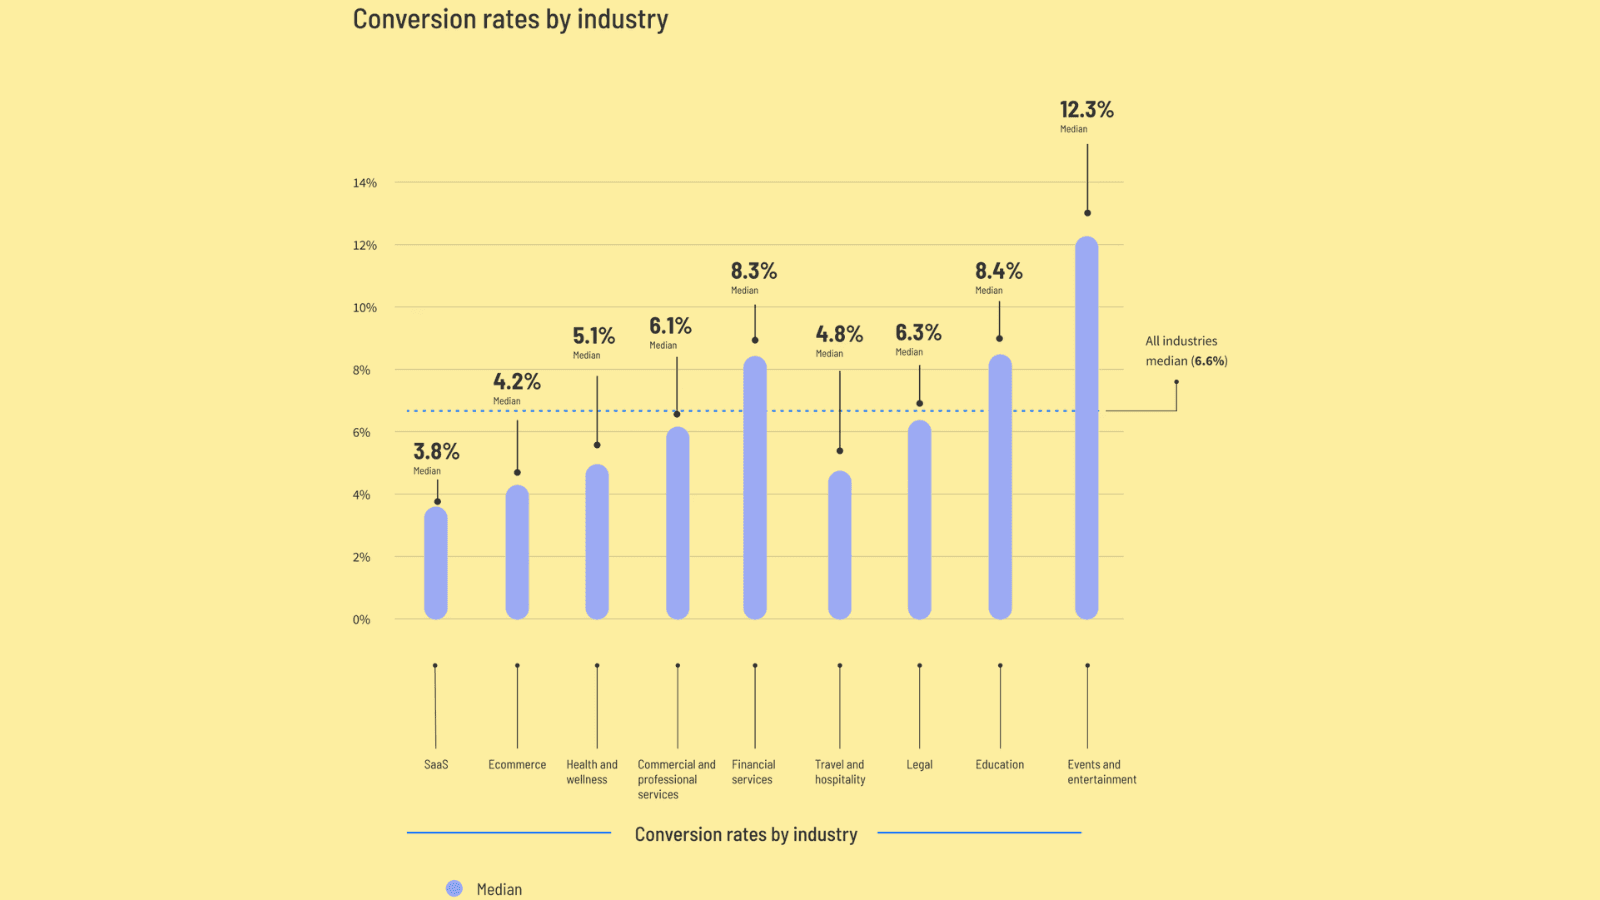
Here’s your cheat sheet to understand how to use these industry benchmarks:
Your landing pages’ conversion rate > Industry Benchmark = Your landing page is performing better than the average landing page in your industry.
Your landing pages’ conversion rate < Industry Benchmark = Your landing page is performing poorer than the average landing page in your industry.
Top 36 Landing Page Statistics You Should Know
Still working with landing page statistics 2022? Not anymore, refresh your landing page statistics with our crisp list below. Without further ado, here are the top 36 stats you should know:
1. 83% of landing page visits take place on mobile devices. However, mobile traffic converts 8% less than desktop traffic.
Mobile devices are the present and the future. Ask yourself—how much time do you spend on your mobile as compared to your desktop? Significantly more, right? Well, your audience does, too. And so, your landing page must be optimized for mobiles. Make sure the landing doesn’t get stretched unevenly or cut out half the text when accessed from mobiles.
At the same time, don’t ignore its desktop version either. Unbounce finds that while mobile visitors are more, desktop converts better. Our take? Optimize both.
2. Landing pages written at 5th to 7th grade level convert 11.1%-56% higher than those written at an 8th-9th grade level.
Keep it simple. Overly complex words won’t do you any favors. Instead, they will cost you. Ensure your landing page writing is between 5th and 7th grade for maximum impact on your audience.
Unbounce finds that there is a negative correlation between difficult words and your conversion rate. Not only that, but it's getting worse. In 2020, the correlation stood at -15%. Today, it's 24.3%, a whopping 62% increase.
3. 38.6% of marketers say video elements boost the landing page conversion rate more than any other element.
Videos are quickly gaining traction as the preferred form of media. And why not? They’re interesting and are able to grab the audience’s attention effectively while allowing you to convey all the important information you want your audience to know.
Consider adding it to your landing pages as well to boost your average landing page conversion rate.
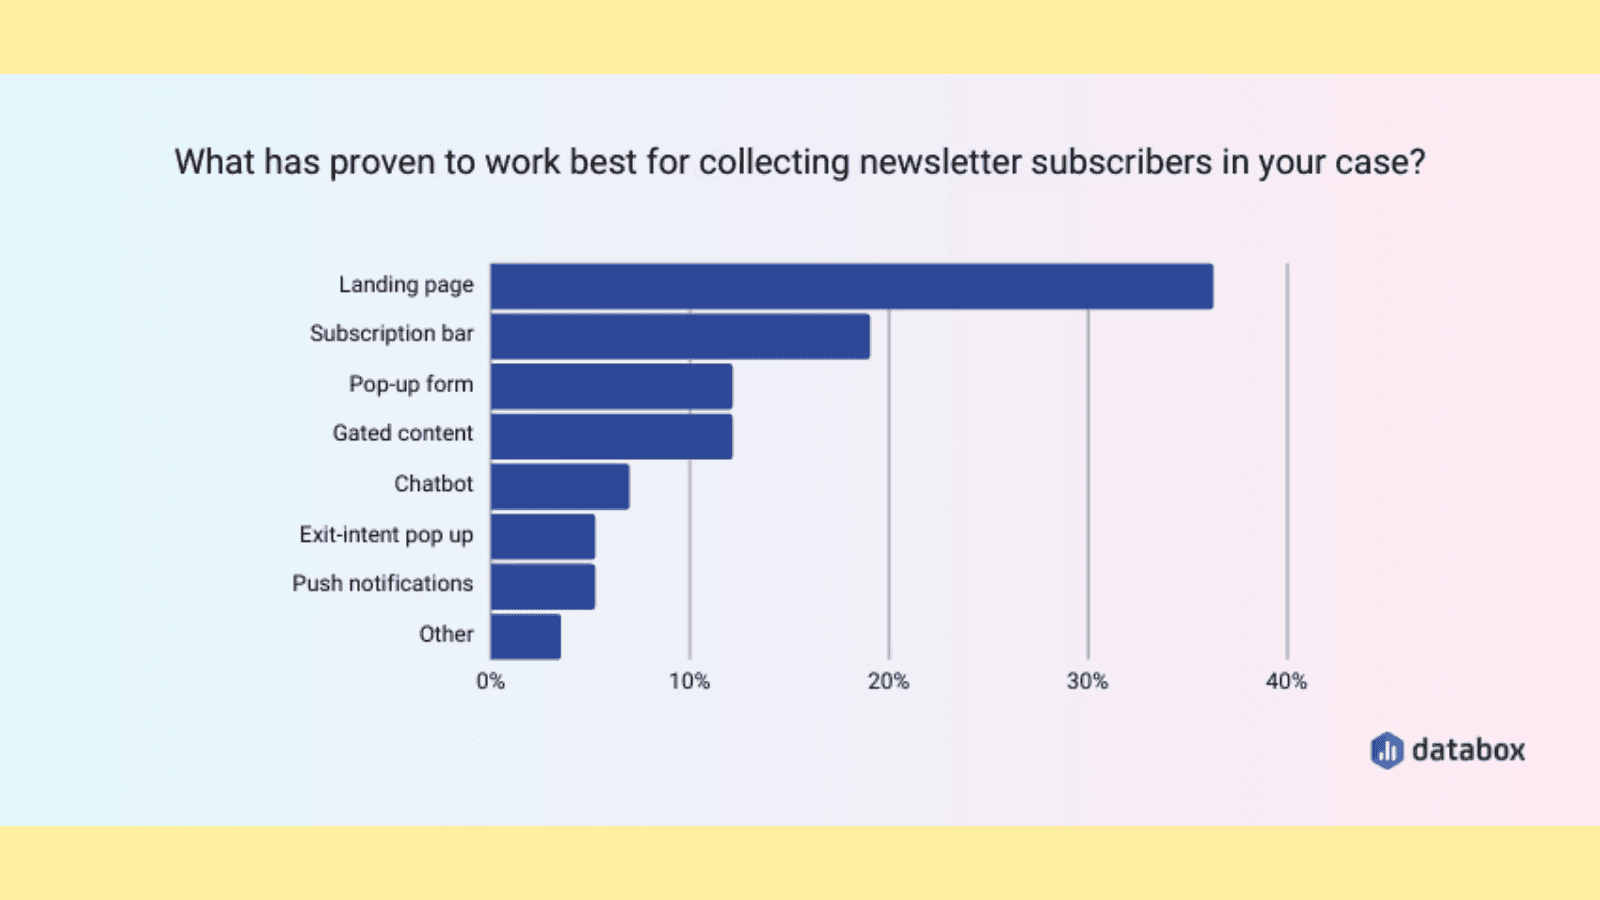
4. 35% of B2B marketers say landing pages were the top choice for collecting newsletter subscribers.
Databox’s survey reports that 35% of respondents find landing pages to be the most successful way of collecting newsletter subscribers. To do this, 70% of respondents concentrate on optimizing their Call to Action (CTAs), 50% offer incentives to attract subscribers, and 40% tweak content depending on audience preference.
5. 27% of marketing decision-makers report using automation for landing pages.
Statista’s global survey finds that 27% of respondents use automation for landing pages. Further, businesses leveraging optimization software witness an average conversion lift of 30%.
Optimization tools can help you recognize, tweak, and improve your landing pages in a fraction of the time it would take team members while also eliminating any chance of human error.
6. Companies say clear CTAs are the most important factor in creating high-converting landing pages.
Databox’s survey finds that clear CTAs are considered a top priority when designing a landing page. You see, your landing pages’ CTAs are aimed to nudge visitors towards the next step. A well-designed one that gives visitors concise and unambiguous instructions has a higher chance of success than one that confuses the visitor, leading to inaction.
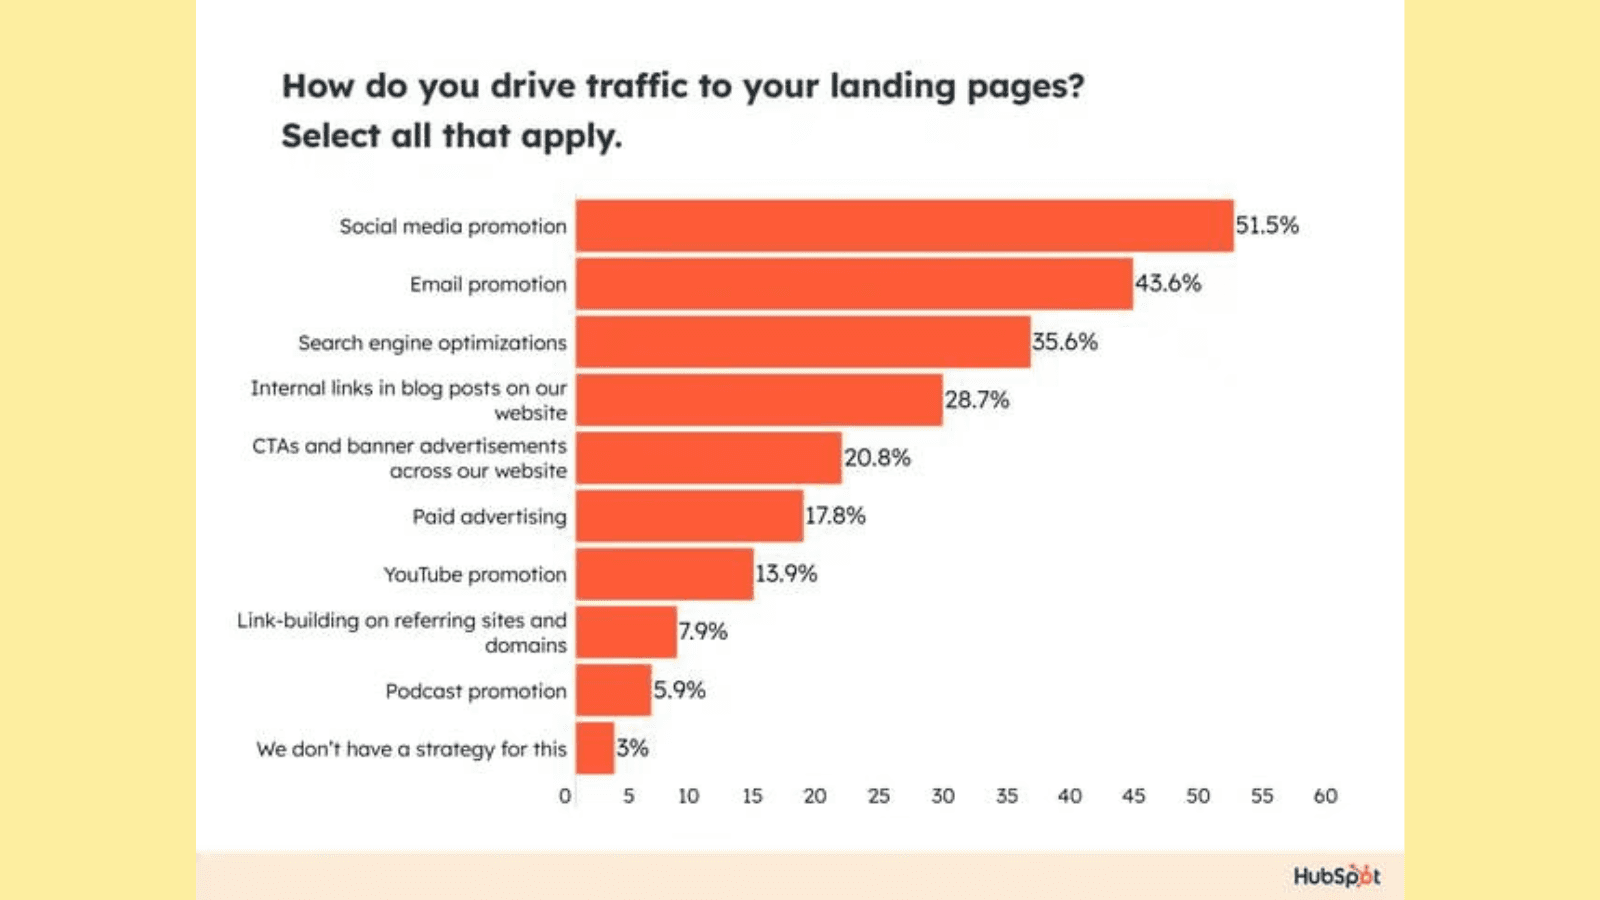
7. Marketers use a combination of tactics to drive landing page traffic.
Sorry to say, there is no single channel that does the trick when it comes to bringing traffic to your landing page. In fact, it takes a couple of them. HubSpot’s survey finds that the list includes social media promotion (51.5%), email marketing (43.6%), search engine optimization (35.6%), and paid advertising (32.7%), among others.
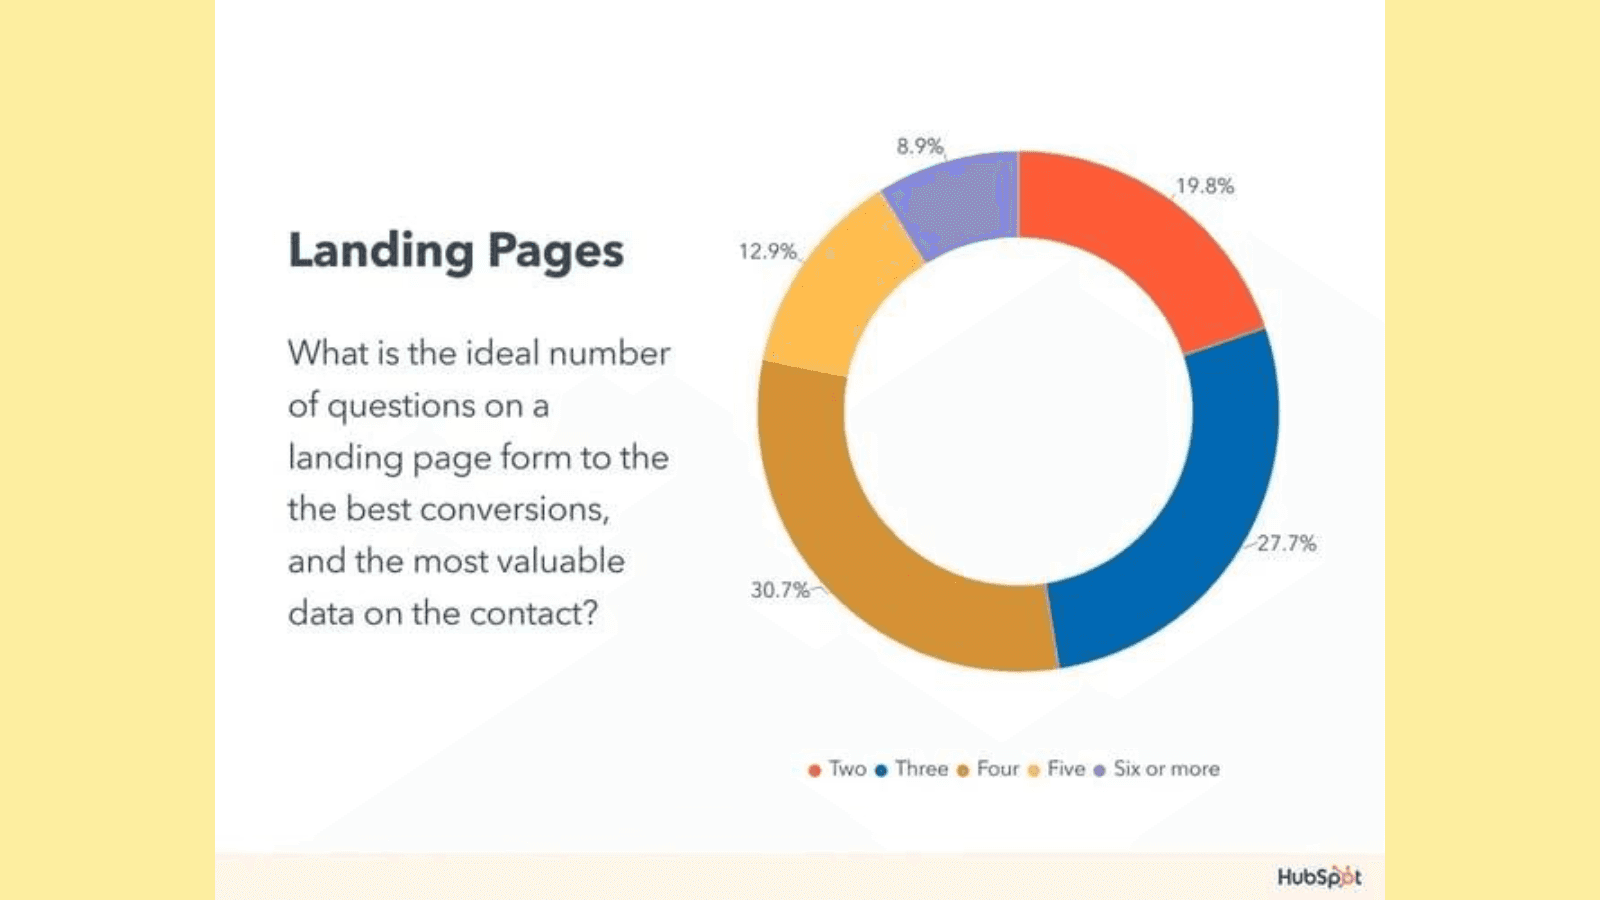
8. 30.7% of marketers believe 4 is the ideal number of questions on a landing page form.
Now, while there is no straight jacket solution or a golden number that would work for all landing pages, HubSpot’s survey does find that the optimal number of questions on your landing page is four and no more (rhyme intended).
9. Landing page signup forms are the least preferred but have the highest conversion rate.
Omnisend finds that while landing pages are the least preferred platform or sign-up forms, they bring home the maximum conversion rate. They are followed by an interactive Wheel of Fortune.
So, if you’re wondering where to add sign-up forms for newsletters, webinars, or email marketing campaigns, your landing pages should be at the top of the list.
10. 10.9% of marketers say that only the user's name and email are essential for landing page forms.
HubSpot’s survey finds that marketers use sign-up forms to collect information such as location, company size, phone number, company industry, etc. 10.9% of the respondents say only name and email are essential. Considering the previously mentioned landing page statistic that says 4 is the ideal number of questions in a landing page form, it’s best to stick to the essentials depending on your specific goals.
11. Discussing buyer fears on landing pages can drive conversion rate by 80%.
It's natural for your visitors to have doubts about sharing their data and ask questions such as, “Will I get spammed?”, “Why do they want my data?” and “What will they do with it?”
Save them the mental turmoil and you the loss of a lead and address the fears at the onset. Being honest about what your visitor can expect after filling out a form or completing an action fosters a relationship of trust and improves the chances of them following through.
12. 47% of consumers expect pages to load in 2 seconds or less.
Optimizing your landing page means personalizing CTAs and adding visual elements while also ensuring they all materialize on your visitor’s screen within the first 2 seconds. Visitors are impatient with the number of offerings today, so you need to serve up your dish quickly, or they’ll leave the table.
13. Landing pages that load within a second convert 3 times higher than those that load in 5 seconds.
Building on the previous landing page statistic, your landing page’s loading time shares an inverse relationship with its conversion rate. The higher the loading time, the lower the conversion rate. Portent finds that a site loading within 1 second converts 3x higher than one that takes 5 seconds to load.
14. Over 90% of companies plan to optimize landing page loading time to drive conversion rates.
Given the landing page statistics we’ve just mentioned, it should come as no surprise that a majority of businesses aim to optimize their landing page loading time to improve their conversion rates. After all, if your landing page takes too long to load, its visual elements, CTAs, designs, etc., won’t even get a chance to work their magic on the visitor.
15. Businesses increasing the number of their landing pages from 10 to 15 witness a 55% increase in leads.
HubSpot’s Marketing Benchmark Report finds that companies see a 55% rise in leads when increasing the number of their landing pages from 10 to 15. This is because they have different landing pages to target specific audiences based on the source that brought them to the landing page.
Considering that and the specific audience’s pain points, motivations, and goals while designing the landing page allows the latter to offer a personalized experience to the visitor, improving their chances of converting.
16. Lead generation is the top priority with landing pages.
43.6% of marketers leverage landing pages to drive lead generation efforts, with 33.7% using them to improve direct customer purchases. If you’re one of these, landing pages should be your top tool to achieve the goal.
17. Long landing pages can generate 220% more leads than short landing pages.
Think about it. If you’re serious about purchasing something, you’d want to know everything about it, right? Well, that logic applies to your visitor and your landing page, too. Increase the amount of information on landing pages, and you’re more likely to attract serious purchasers.
18. Landing pages with webinar promotions have the highest conversion rates.
According to GetResponse, landing pages that promote webinars have the highest conversion rate at 22.3%, followed by those with a sign-up form with two fields (12.73%) and a form with one field (11.26%).
19. Personalized CTAs drive visitor conversion rates by 42%.
CTAs that resonate with the visitor and are customized to their journey, pain points, goals, or motivations drive conversion rates by 42%. Today, you need to make your visitors feel like the landing page was made for them. Include personalized elements such as the source through which they landed on the page, their location, etc., to make the CTA truly impactful.
20. Including the word ‘submit’ in your CTA can reduce conversion rates by 3%.
Avoid using the word ‘Submit’ in your CTA, as Unbounce finds that adding it can reduce your conversion rates by a good 3%.
21. The right headline can increase conversions by 307%.
Your landing page headline should be crisp and clear and communicate your value proposition accurately, encouraging the visitor to learn more about your offering.
While there is no precise science to it, personalizing your headline to resonate with your audience and including words that your audience uses to search for solutions for the problem your offering solves can help create an impactful headline.
22. 30% of companies will leverage AI to improve A/B testing by next year.
AI is making its way into everything from creating marketing strategies to content calendars. So, it should come as no surprise that 30% of companies are expected to integrate this revolutionary technology into their A/B testing efforts by 2025.
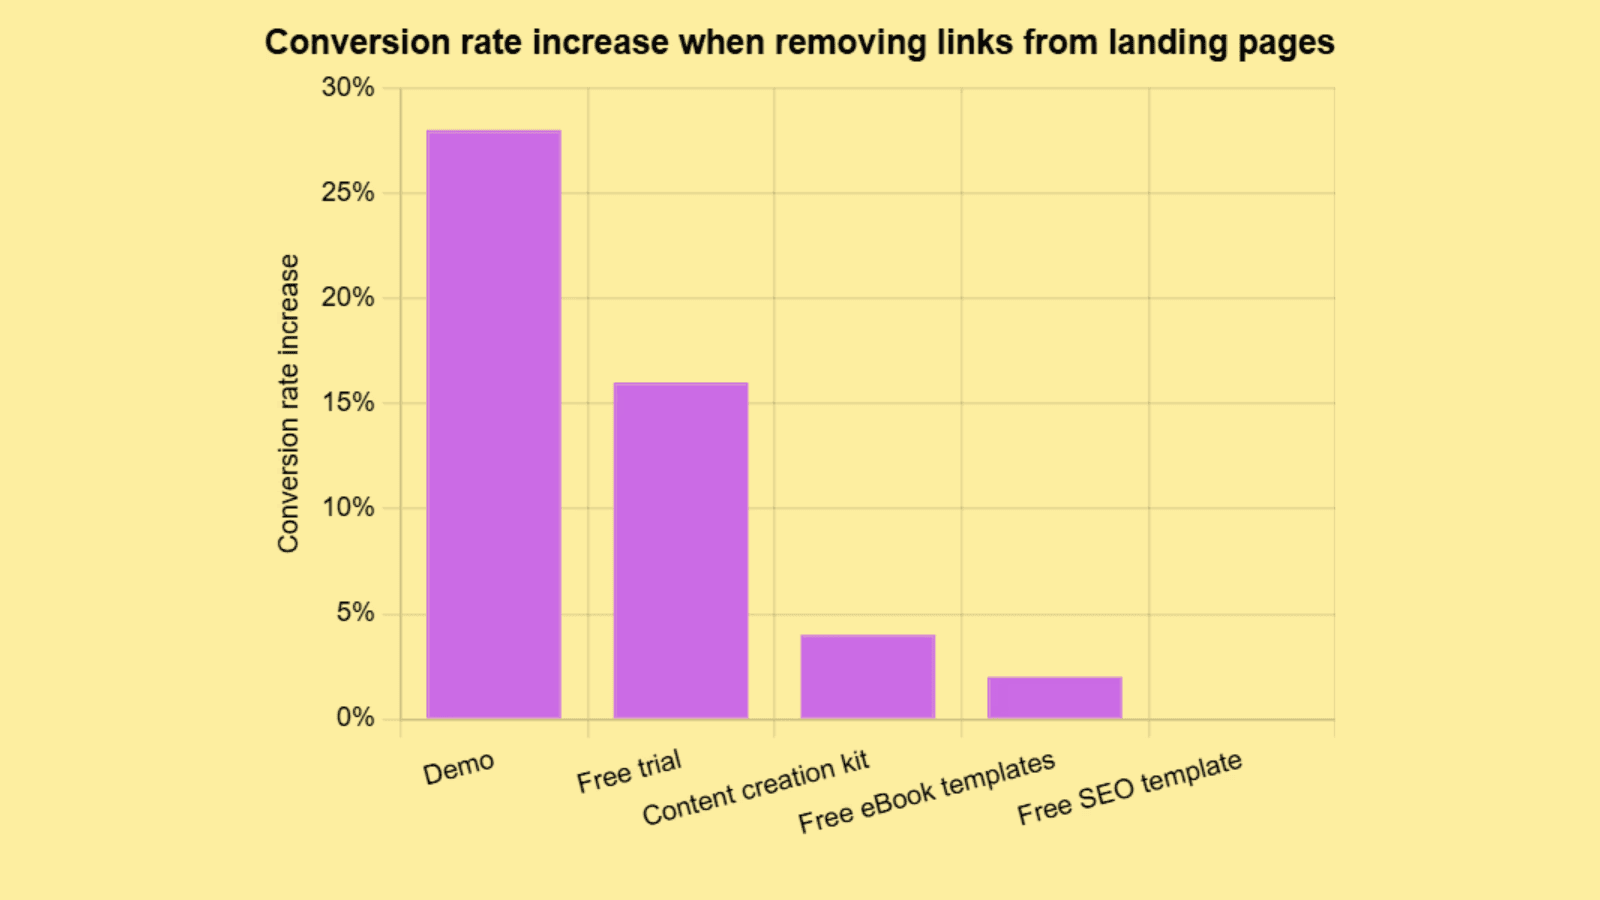
23. Removing links from demos can lead to a 28% increase in conversion rates.
A/B testing has found that eliminating links to product demos can help drive conversion rates by 28%.Further, removing free trials increases conversion rates by more than 15%.
24. Dynamic landing pages convert 25.2% more mobile users.
A dynamic landing page adjusts its layout and content depending on the unique user data (device type, location, browsing history, etc.) automatically. Since most users use mobiles, dynamic landing pages can help improve user experience, and readability.
25. 48% of marketers build a new landing page for every new campaign.
Personalization is the name of the game. Today, you can’t have one landing page for 10 different products and expect the user to navigate their way around the website to find the exact product they saw in the ad that brought them to the landing page.
So, create fresh landing pages for every offering. For example, if you have three different pairs of the same sneakers, create different landing pages for each.
26. Click through landing pages perform best.
Click-through landing pages encourage visitors to take a desired action (e.g., make a purchase, sign up for a newsletter). These landing pages only have clickable content and perform better than landing pages with forms.
27. As the number of elements on a page increases, the conversion rate drops.
Google reports that as the number of elements such as titles, texts, and images on a landing page increases from 4,000 to 6,000, the chances of conversion drop 95%. It's important to find a balance between creating an engaging, personalized, and informative landing page and overburdening it with too many elements that overwhelm the visitor, making them bounce off.
28. Color improves brand recognition by 80%.
Don’t go for a boring, monochromatic landing page. Instead, consider adding color, which is found to be directly correlated to producing more leads. Research finds that color can help increase brand recognition by a whopping 80%.
29. Multiple offers on a single landing page can reduce conversion rates by up to 266%.
Less is more when it comes to your landing page. According to Mailchimp, having multiple offers on a single landing page can confuse visitors and reduce the conversion rate by 266%.
30. 20% of businesses don’t have a landing page testing strategy.
A shocking 20% of companies still lack landing page testing and optimizing strategy. You best believe they’re living on borrowed time. Be sure to create a robust optimization strategy that allows you to track all vital landing page metrics periodically.
Meticulous and systematic tracking allows you to identify landing page errors before they snowball into problems that affect your conversion rate.
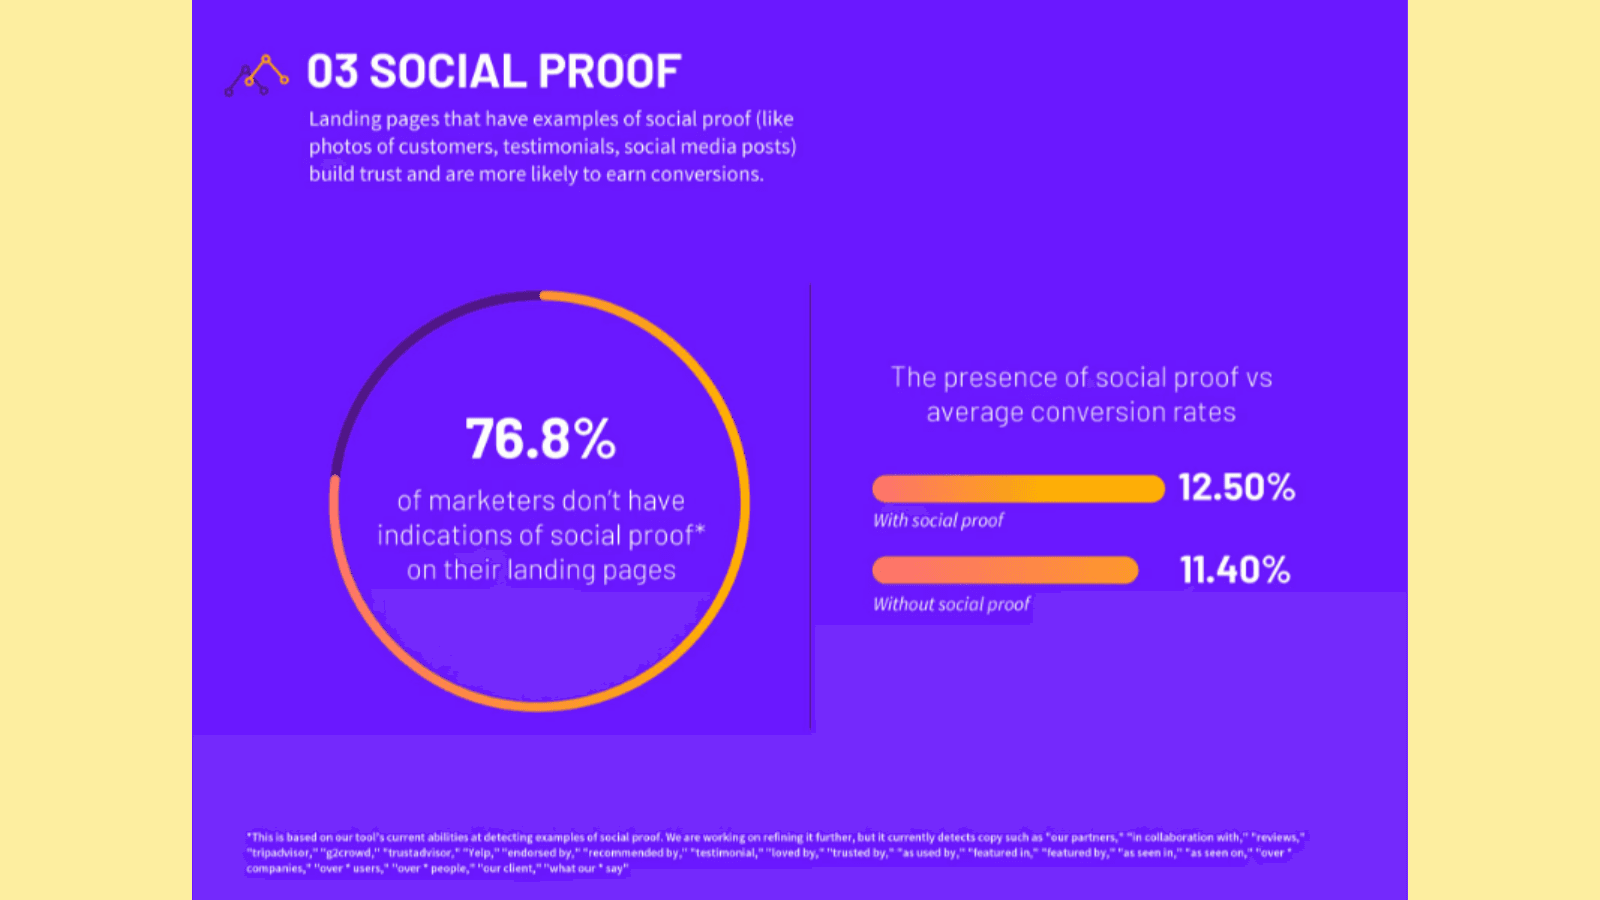
31. Social proof on landing pages can boost conversion rates by 1.10%.
Including some form of social proof on your landing page can boost conversion rates by 1.10%. You see customer testimonials, reviews, and the like help convince new customers of your credibility and encourage them to take a chance on your offering. Unfortunately, 76.8% of marketers still don’t have any social proof on their landing pages.
32. Removing your navigation menu can increase conversions by 100%.
Consider eliminating your navigation menu from your landing page to drive the conversion rate.
33. The average landing page bounce rate ranges between 60%-90%.
Customers can bounce off landing pages due to a number of reasons, including slow loading time, not finding what they were looking for, etc. Optimize your landing page to keep your bounce rate low.
34. 75% of consumers prefer to buy products in their native language.
Consider including content in all the languages your audience speaks to personalize their landing page experience. A dynamic landing page can help you ensure your landing pages adjust depending on unique user data, such as location.
35. 62% of consumers say they won’t remain loyal to a brand that provides an impersonalized experience.
As mentioned before, personalization is key today. Not just to attract your customers but to keep them as well.
36. 48% of visitors leave landing pages without interacting further with marketing materials.
Gartner finds that 48% of website visitors leave the primary landing page without engaging with marketing elements. To avoid this landing page statistic to join the agenda of your quarterly meeting, consider optimizing your landing pages to personalize them to visitors’ pain points, goals and motivations. If your landing page speaks directly to the visitor, chances are higher that they’ll stick around to explore your offerings.
Conclusion
Landing page stats can get you to the door. Understanding and leveraging them effectively will help you open that door. Allowing these solid numbers to guide your landing page strategies will enable you to optimize your average conversion rates on landing pages.
That said, key metric averages across industries can differ. And so, be sure to set benchmarks according to your industry and make them achievable to keep the momentum going steadily. Don’t expect to go from 0 to 100 within a quarter. Create a practical strategy, stick to it, and watch yourself achieve a good landing page conversion rate.
What’s more, you don’t have to do it alone. Partner with Fibr AI to improve your landing page conversion statistics. This handy tool empowers you to personalize your landing pages for every ad, product, keyword, and more! The result? Improved conversion rate, reduced Customer Acquisition Cost (CAC), and an optimized post-click experience. So, start experimenting and publishing 1000s of AI-tailored landing pages with Fibr AI today!
Book a demo to check out Fibr AI in action now!
FAQs
1. What is the average conversion rate for landing pages?
The average landing page conversion rate across industries is 6.6%. However, each industry has a different landing page conversion rate benchmark. For instance, the Software as a Service (SaaS) industry has an average conversion rate of 3.8%, while the food and beverage industry has a 7.1% rate.
2. How do you calculate landing page rate?
To calculate the landing page rate, divide the number of users who converted (took a desired action) by the number of users who visited the landing page and multiply the result by 100.
3. How to measure landing page success?
To measure your landing page’s success, track and monitor metrics such as conversion rate, bounce rate, landing page view rate, average time spent on the page, sessions by source, cost per conversion, return vs new visitors, and form abandonment.


