What are A/B Test Results & How to Interpret Them?

Meenal Chirana
Aug 16, 2024
Dec 10, 2025

Read summarized version with
Introduction
Imagine you’re running an online store and debating whether to use a bold red or a calming blue for your call-to-action button. You choose red, thinking it’s attention-grabbing, but your colleague insists blue would work better. Instead of guessing, you decide to run an A/B test. After a few days, the data is in: one color clearly outperforms the other in driving clicks and sales. But what does that really mean? How can you trust these results to make the right decision?
A/B testing is more than just a buzzword in marketing and web optimization; it’s a powerful tool for making informed choices backed by data. However, while setting up an A/B test might seem straightforward, interpreting the results often feels like decoding a foreign language. Is the result statistically significant? What does the conversion rate tell you? And how can you be sure the results reflect what will work long-term?
In this article, we’ll break down the mystery of A/B test results, discussing what A/B test results are and, most importantly, how to interpret them accurately to wring every last value out of the test.
What are A/B Test Results?
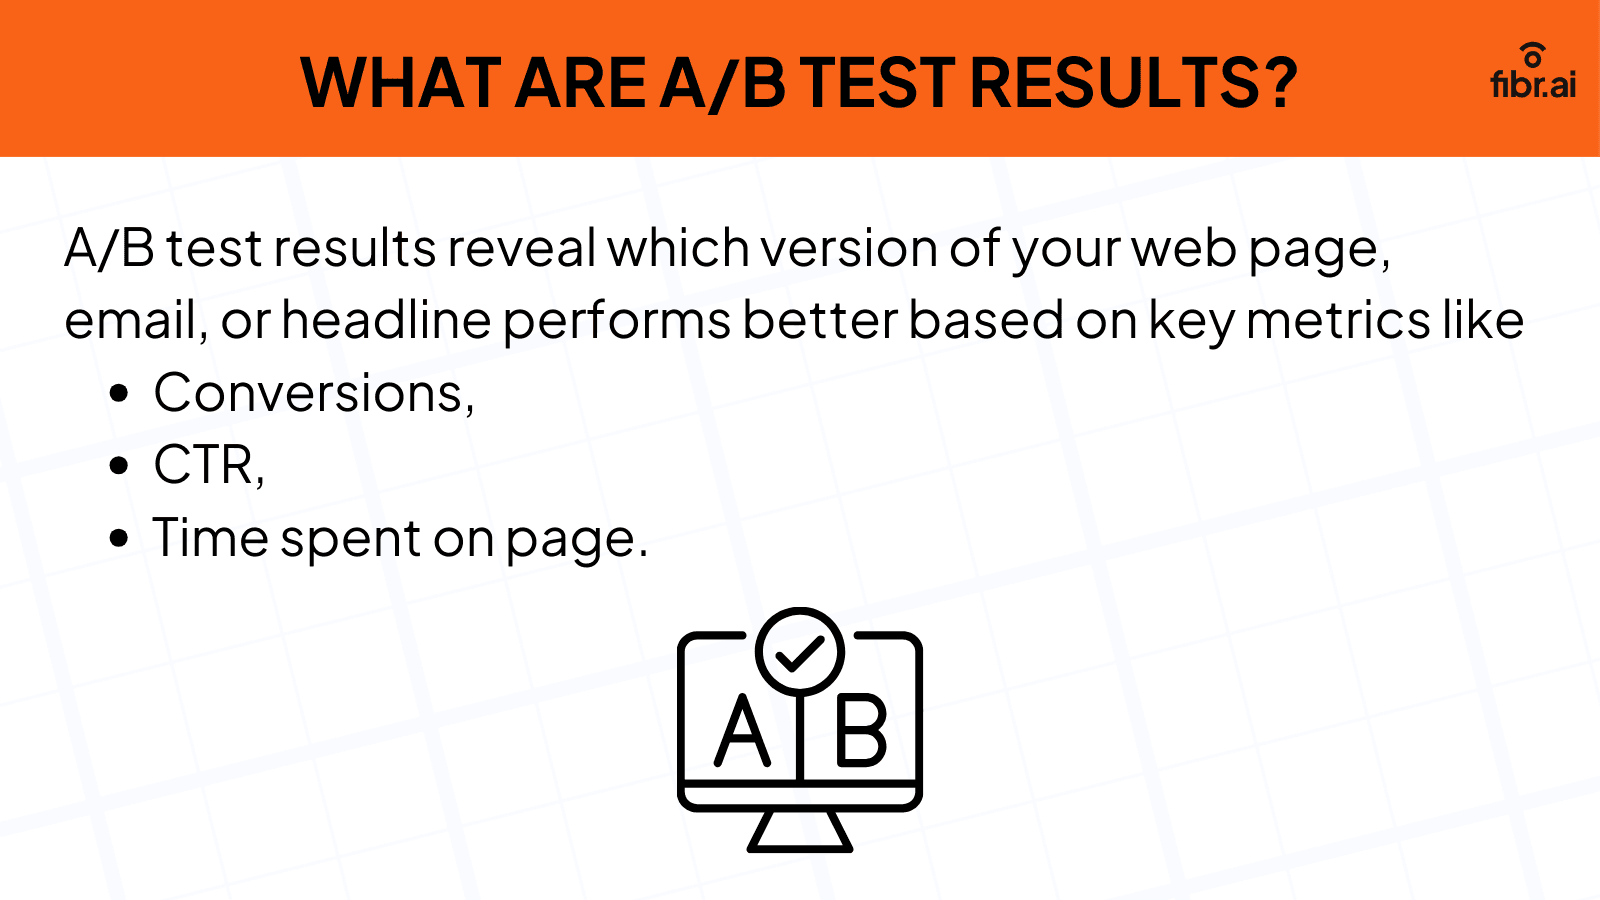
A/B test results are the outcome of A/B tests, which involve comparing different versions of a web page, email, or some specific element within them, such as an email subject line or a headline, to ascertain which version performs better. The two versions of the same element is tested to measure key metrics which can include conversion rate, time spent on page, CTR, etc.
For instance, let’s say you have a sales engagement platform- XYZ, and want to drive conversions. You can use A/B testing to determine whether your landing page headline should be ‘Boost your sales process with XYZ’ or ‘XYZ- your sales team’s ultimate companion’.
The test will record how both headlines perform and ultimately give you the AB test result. And with that you have your answer regarding which headline should make it to your landing page.
How To Interpret AB Testing Results?
Analyzing your A/B results is arguably the most crucial stage of an AB test. Despite this, it's one of the least discussed aspects of AB testing.
However, before we get into that, it's important to touch upon two critical metrics. These include:
Uplift: This refers to the difference between the performance of the element getting tested and the performance of its baseline version (this is typically the control group). For instance, if one version has a revenue per user of $5, and the baseline version has a revenue per user of $4, the uplift in this case would be 25%.
Probability To Be Best: This refers to the likelihood of a version having the best long-term performance. In other words- the version that wears the crown in your A/B testing results report. It’s important to note that the Probability To Be The Best metric doesn’t begin calculating unless there have been 30 conversions or at least 1000 samples.
One good way to understand the above two metrics is that Probability To Be Best metric answers- Which version is better, and Uplift metric tells you by how much.
Now, when interpreting AB results, you need to make your way through three levels. Here they are, in chronological order:
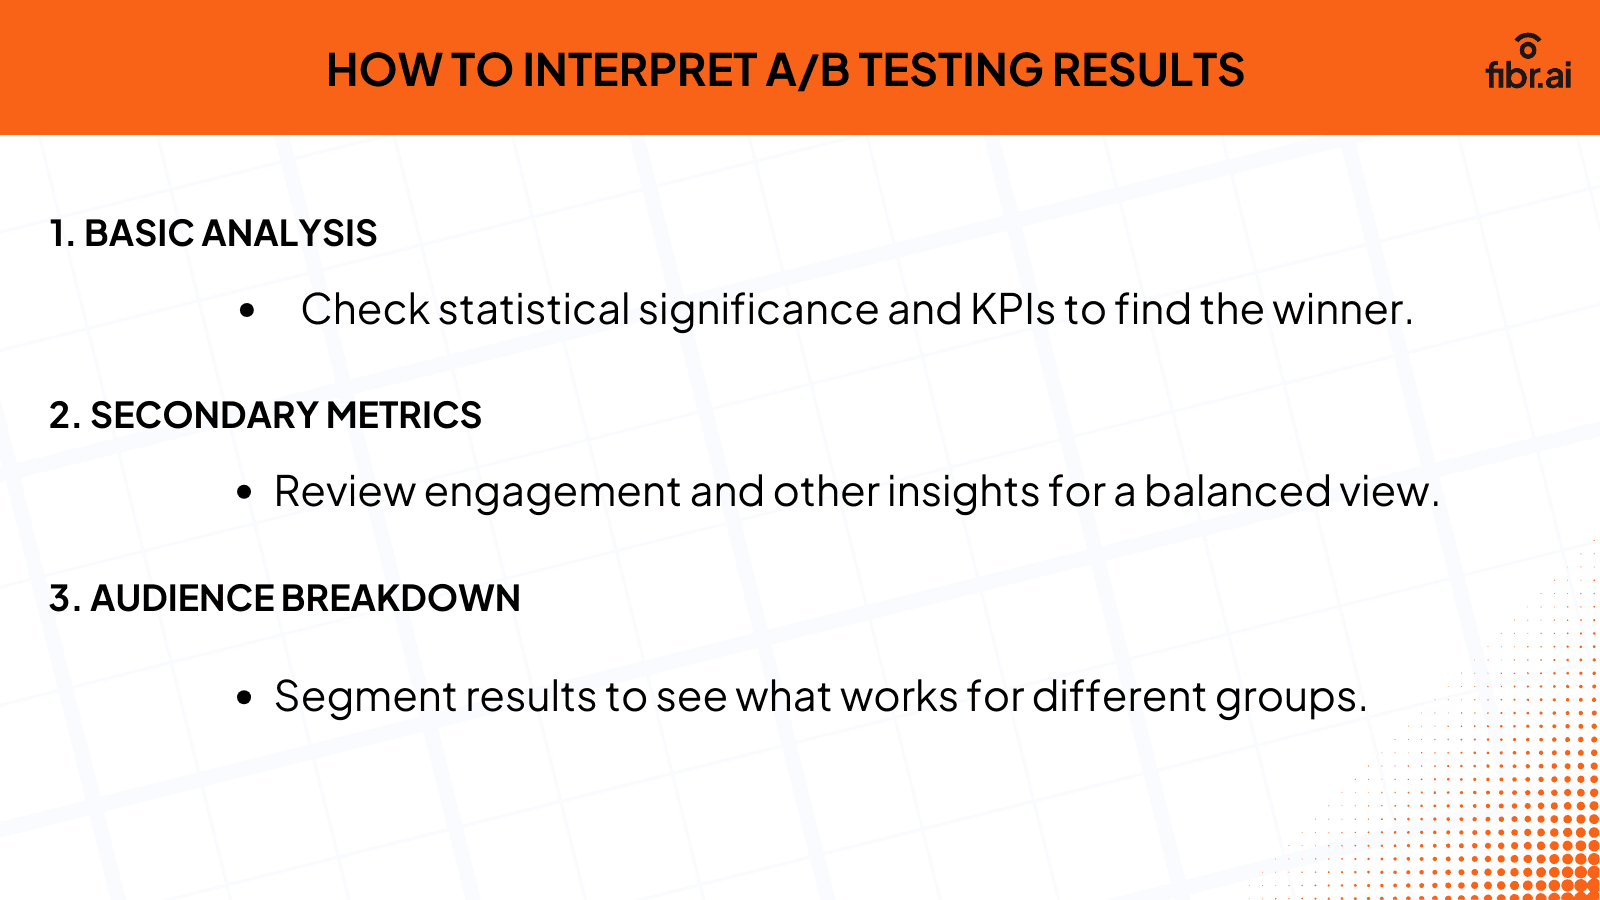
1.Basic Analysis
Once you receive your AB testing results, the first thing you should do is check whether your A/B testing results have a winner and whether the results are statistically significant.
Statistical significance in AB results refers to ascertaining the probability that the AB testing results are not due to chance and depict the accurate difference between the two tested versions.
Typically speaking, your A/B test results’ winner will only be determined if the following conditions have been fulfilled:
One of the two versions has a Probability To Be Best score of 95% or higher (you can change this standard using the winner significance level or similar setting on your chosen A/B test tool).
The test has run for the specified minimum duration (usually two weeks—but it can be tweaked to ensure the A/B test results aren’t compromised due to seasonality.
Now, compare the baseline version’s performance to the challenger version’s. Your winner would have performed better on the Key Performance Indicators (KPIs) that you’re aiming for.
2.Secondary Metrics Analysis
The basic analysis method takes primary metrics into account, such as your conversion rate or revenue per user. The secondary metrics analysis method, as the name suggests, factors in secondary metrics (engagement metrics, return visitor rate, cart abandonment rate, etc.) that might not be part of the AB testing goal but are nonetheless important to consider.
Taking the time to perform this analysis offers the following benefits:
Help you avoid mistakes
Performing secondary metrics analysis helps you avoid getting blindly carried away in the celebrations of driving your primary metric. For instance, your winning version might have performed well as per your primary metric- Click-Through Rate (CTR), but instead cost you your revenue or Average Order Value (AOV).
With a secondary metrics analysis, you get a more balanced picture of your winning version’s performance.
Uncover interesting insights
Digging deeper into your AB test results with secondary metrics can help you get other interesting insights that might not be apparent on the face of the results. For instance, let’s say your AB testing results find that for the winning version, the purchase per user fell, but the AOV rose.
This could mean that your winning variation prompted users to purchase less in quantity but purchase more expensive products, driving revenue. Something you wouldn’t happen upon if you didn’t undertake secondary metric analysis.
Pro tip: Analyze your Uplift and Probability To Be Best scores for each secondary metric to understand how each version performed. This will tell you whether you can serve all your traffic with the winner version or instead tweak your allocation depending on what you’ve uncovered.
3.Audience Breakdown Analysis
The final analysis that helps you truly wring every last drop of value out of your AB testing results involves segmenting your audience by behavior, demographics, or any other relevant factors. Doing this allows you to answer questions such as:
How did the traffic source affect the test results?
Which version won for desktop, and which one won for mobile?
What version works best for new users?
Now, while it can be tempting to segment your audience mercilessly to drive personalization, keep the following in mind during segmentation:
Keep segments large enough to ensure statistically significant results
Keep segments relevant to your business goals
Keep segments actionable in terms of personalization efforts or any other future strategy
Again, for every audience, analyze the Uplift and Probability To Be Best metric scores to ascertain how every version performed. This will help you determine whether you should serve the winning version to all your traffic or tweak it based on your learnings.
Make your way through the A/B test results according to the above and you can rest assured that you’re getting the most out of your AB testing results.
But wait, there’s more.
At the beginning of this section, we’ve presumed that your AB testing results have found a winner. But what if your test doesn’t come with a winner? What happens then?
Is the test redundant? Does all hell break loose?
No, and no. You see, as personalization takes center stage with customer engagement and conversions, tests and experimentations that don’t consider the distinct individual audience conditions often conclude with no winner, with statistical significance becoming difficult to achieve.
In other words, the usual one-to-many testing approach will not work for all visitors anymore. There will always be a portion of your audience that your winning version will not address.
Once you understand this significant drawback of AB testing, you come to the conclusion- that AB tests with no winners might actually have winners, too.
Let’s take an example to understand this better.
In the following AB test that ran for 30 days, the AB testing results reported the control version outperforming the challenger version.
With this, you’ll naturally believe the challenger version is just sub-par. But break the test down by devices, and you uncover a completely different picture.
Breaking the test down by user devices, the controller version wins on desktop, but the challenger version outperforms it on tablet and mobile.
This example is meant to underscore the importance of dissecting your A/B test results. Only once you’ve analyzed your AB results can you confidently move to implement the conclusion of the test.
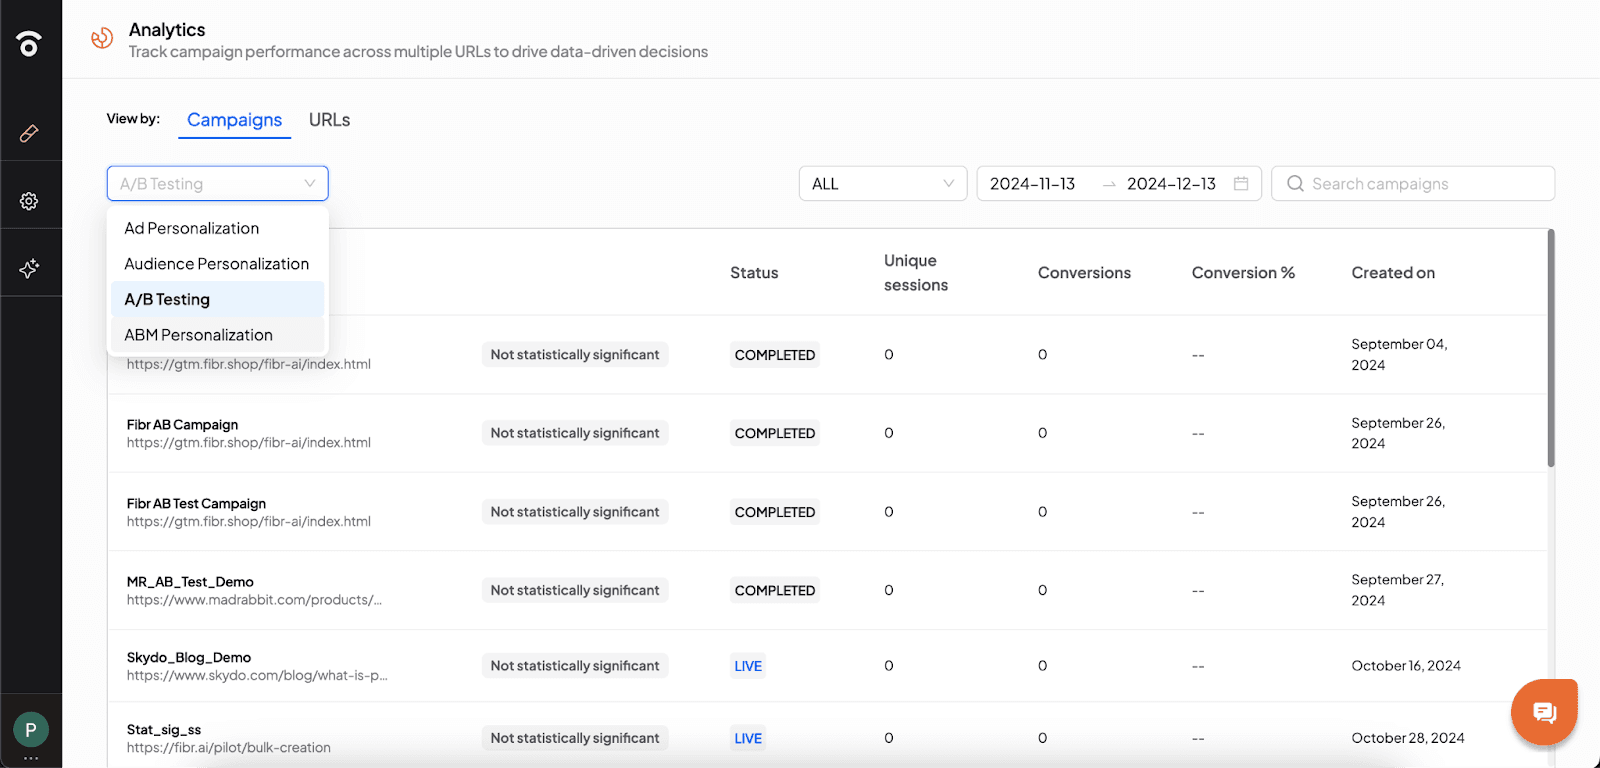
But what if we told you, you could make all this easier and quicker? All you need is a tool like Fibr AI. With a powerful reporting and analytics feature that gives you an in-depth analysis of your campaign performance, Fibr AI helps you get instant insight into which variation is your top performer. As a result, fueling quicker optimization, informed decision making and overall campaign efficiency.
Why Is Understanding AB Test Results Important?
Understanding A/B test results isn’t just about knowing which version performed better—it’s about uncovering why it worked and how those insights can shape your strategy. By interpreting results accurately, you can make data-driven decisions, avoid costly missteps, and continuously optimize for success.
Let’s explore why digging into these results is crucial for building smarter, more impactful campaigns:
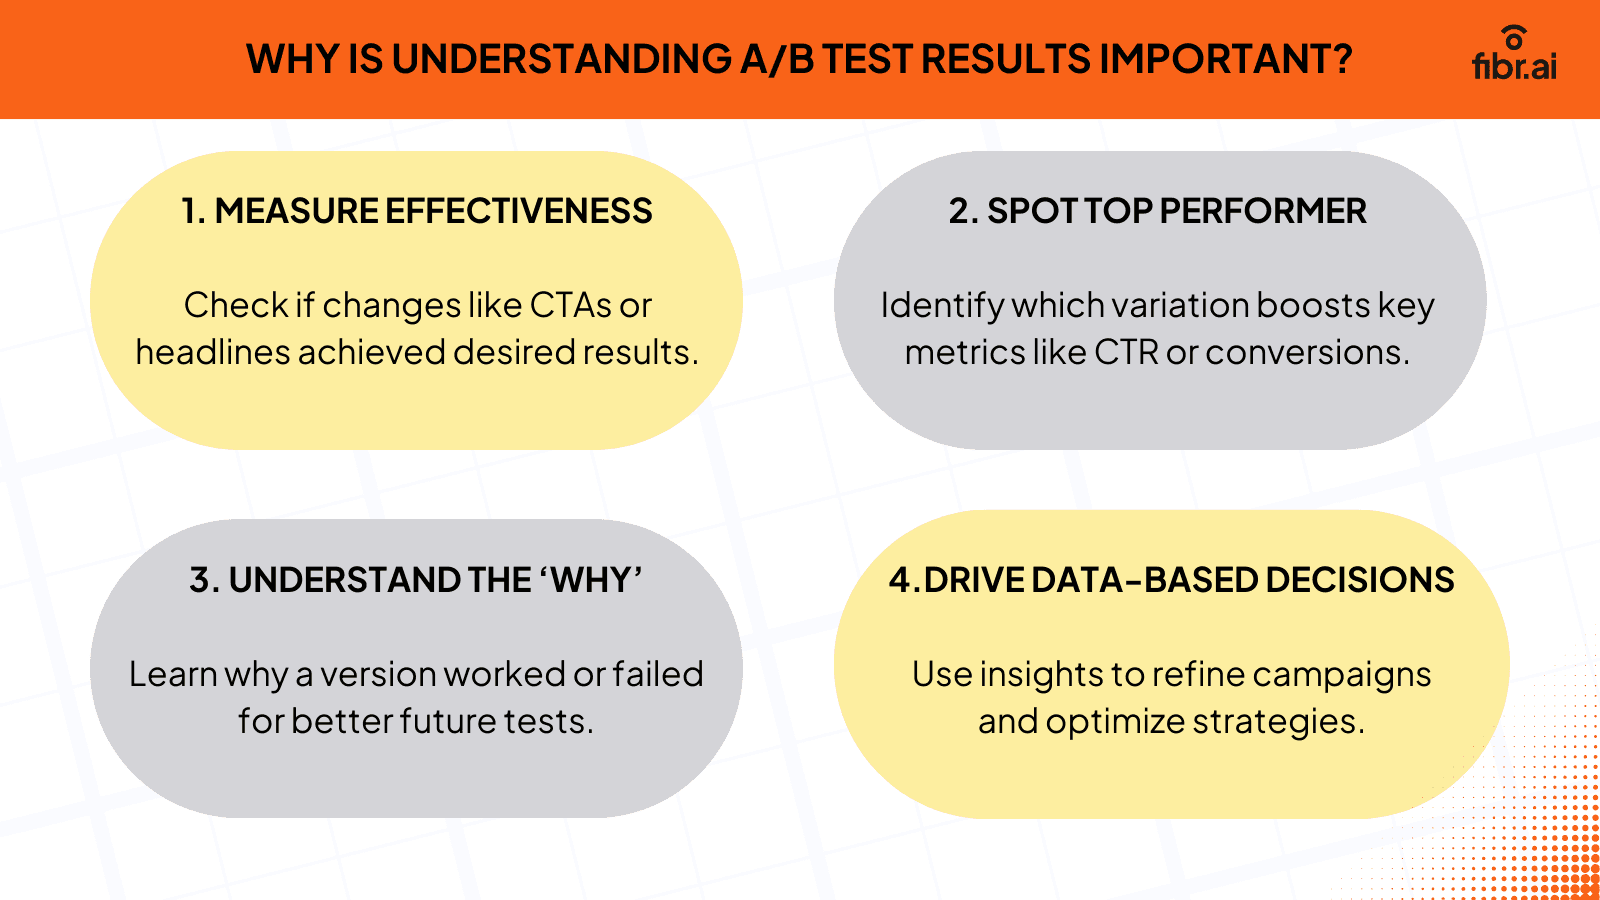
1.Ascertain the Effectiveness of Changes
Analyzing, interpreting, and digging deeper into your AB testing results can help you understand whether the changes you made have the intended effect on your desired metric. These changes can include Calls to Action (CTAs), headlines, content, or even buttons on your landing page.
2.Identify Your Top Performing Variation
Examining and comparing test performances of the different variations can help you recognize the changes that help you drive your KPIs and metrics, such as CTRs, conversion rates, etc.
3.Understand The ‘why’ Behind The A/B Results
Interpreting your A/B results helps you understand the reason why specific variations perform better or worse. This, in turn, helps you deploy better tests and make more informed optimization decisions.
4.Make Data-Driven Decisions
With AB test results, you get a deeper understanding of your customers’ behavior—giving you an invaluable resource to help make a wide range of decisions, even those that aren’t directly related to the A/B tests.
Further, by diving deeper into your AB test results, you can make sound decisions about whether to keep testing, change its direction, or implement the change.
Components To Look at When Interpreting AB Test Results
When analyzing the results of an A/B test, it's essential to evaluate several factors to draw meaningful insights. Here are some key considerations to ensure your conclusions are accurate and actionable:
1.Size of the AB Test Sample
The size of your sample plays a critical role in the reliability of your A/B test. Small samples often lead to inconclusive findings, while excessively large samples can amplify minor variations, making them appear statistically significant. To achieve dependable results, ensure your sample size aligns with the scale of your test and audience.
2.Duration of the A/B Test
The age-long question- How long should I run A/B tests? has no satisfactory answer. Deciding the ideal test duration depends on factors like traffic patterns, audience behavior, and the nature of the test.
Typically, tests should run for at least one or two weeks to capture variations over different days or times. Moreover, statistical significance can guide the decision to end a test. For instance, reaching a 99% confidence level is a strong indicator that your results are trustworthy.
3.Conversion Rates
Tracking conversion rates is a cornerstone of A/B testing, but these metrics must be analyzed in context. Variations in traffic volume can influence conversion rates significantly. A page with high traffic may achieve a better conversion rate compared to one with lower traffic. Neglecting this context can result in misinterpretations of your results.
4.Contextual Factors
External factors, like seasonal trends or competitor activity, and internal factors, such as ongoing promotions or page updates, can impact test results. For example, running an A/B test during a holiday sale might yield inflated traffic and conversions. Without accounting for these variables, your findings may not hold relevance for periods outside of the test window.
5.Statistical Significance
The significance level, often measured by the p-value, helps confirm whether the observed differences between test variations are genuine or due to chance. A commonly accepted p-value threshold is 0.05. If your p-value falls below this, you can confidently reject the null hypothesis, concluding that the differences observed are meaningful.
Level Up with Fibr AI
We reckon you might have realized by now that….A/B testing? Not exactly possible manually, given the sheer number of landing pages and elements in the mix today. The test is powerful and a core need for businesses looking to stay relevant and ahead in the increasingly competitive world. And so, it's important to ensure your A/B testing efforts are nothing short of flawless.
How do you achieve that? Glad you asked. With Fibr AI. Personalize your landing pages for every communication, campaign, and audience with the power of AI. And leverage our powerful AI A/B test testing tool to create, run, and analyze A/B tests on any website.
Ready to level up your online presence? Book a demo today!
FAQs
1. What are A/B tests used for?
A/B tests are used to determine which of the two versions of the same element performs better and drives business goals. It can be applied to headlines, contextual content on your website, email subject lines, page layout, and more.
2.What does the confidence level of an A/B test indicate?
The confidence level of an A/B test tells us how probable it is that the test results are accurate and not due to a random chance. For example, a 78% confidence level indicates that there is a 78% chance that the observed difference in the A/B test results is accurate and aligned with reality, and not due to a random chance.
3.How do I choose my A/B test Metrics?
Your A/B test metrics depend on your unique test goals. That said, some of the most common test metrics include click-through rate (CTR), conversion rate, revenue per visitor, and time on page.
4.What does an A/B test result not being statistically significant mean?
If an AB result is not statistically significant, it means that there is a lack of evidence to support whether the differences observed between the two versions of the element are real. In other words, we cannot confidently conclude that one version is, in fact, better than the other.





Meenal Chirana
Content Marketing Manager
Meenal Chirana, Content Marketer at Fibr, brings five years of experience in the content field to the team. Her passion for creating engaging content is matched only by her expertise in writing, SEO and content marketing . Passionate about all things content and digital marketing, she is always on the lookout for innovative ways to connect with audiences and elevate brands.
Read summarized version with
Introduction
Imagine you’re running an online store and debating whether to use a bold red or a calming blue for your call-to-action button. You choose red, thinking it’s attention-grabbing, but your colleague insists blue would work better. Instead of guessing, you decide to run an A/B test. After a few days, the data is in: one color clearly outperforms the other in driving clicks and sales. But what does that really mean? How can you trust these results to make the right decision?
A/B testing is more than just a buzzword in marketing and web optimization; it’s a powerful tool for making informed choices backed by data. However, while setting up an A/B test might seem straightforward, interpreting the results often feels like decoding a foreign language. Is the result statistically significant? What does the conversion rate tell you? And how can you be sure the results reflect what will work long-term?
In this article, we’ll break down the mystery of A/B test results, discussing what A/B test results are and, most importantly, how to interpret them accurately to wring every last value out of the test.
What are A/B Test Results?
A/B test results are the outcome of A/B tests, which involve comparing different versions of a web page, email, or some specific element within them, such as an email subject line or a headline, to ascertain which version performs better. The two versions of the same element is tested to measure key metrics which can include conversion rate, time spent on page, CTR, etc.
For instance, let’s say you have a sales engagement platform- XYZ, and want to drive conversions. You can use A/B testing to determine whether your landing page headline should be ‘Boost your sales process with XYZ’ or ‘XYZ- your sales team’s ultimate companion’.
The test will record how both headlines perform and ultimately give you the AB test result. And with that you have your answer regarding which headline should make it to your landing page.
How To Interpret AB Testing Results?
Analyzing your A/B results is arguably the most crucial stage of an AB test. Despite this, it's one of the least discussed aspects of AB testing.
However, before we get into that, it's important to touch upon two critical metrics. These include:
Uplift: This refers to the difference between the performance of the element getting tested and the performance of its baseline version (this is typically the control group). For instance, if one version has a revenue per user of $5, and the baseline version has a revenue per user of $4, the uplift in this case would be 25%.
Probability To Be Best: This refers to the likelihood of a version having the best long-term performance. In other words- the version that wears the crown in your A/B testing results report. It’s important to note that the Probability To Be The Best metric doesn’t begin calculating unless there have been 30 conversions or at least 1000 samples.
One good way to understand the above two metrics is that Probability To Be Best metric answers- Which version is better, and Uplift metric tells you by how much.
Now, when interpreting AB results, you need to make your way through three levels. Here they are, in chronological order:
1.Basic Analysis
Once you receive your AB testing results, the first thing you should do is check whether your A/B testing results have a winner and whether the results are statistically significant.
Statistical significance in AB results refers to ascertaining the probability that the AB testing results are not due to chance and depict the accurate difference between the two tested versions.
Typically speaking, your A/B test results’ winner will only be determined if the following conditions have been fulfilled:
One of the two versions has a Probability To Be Best score of 95% or higher (you can change this standard using the winner significance level or similar setting on your chosen A/B test tool).
The test has run for the specified minimum duration (usually two weeks—but it can be tweaked to ensure the A/B test results aren’t compromised due to seasonality.
Now, compare the baseline version’s performance to the challenger version’s. Your winner would have performed better on the Key Performance Indicators (KPIs) that you’re aiming for.
2.Secondary Metrics Analysis
The basic analysis method takes primary metrics into account, such as your conversion rate or revenue per user. The secondary metrics analysis method, as the name suggests, factors in secondary metrics (engagement metrics, return visitor rate, cart abandonment rate, etc.) that might not be part of the AB testing goal but are nonetheless important to consider.
Taking the time to perform this analysis offers the following benefits:
Help you avoid mistakes
Performing secondary metrics analysis helps you avoid getting blindly carried away in the celebrations of driving your primary metric. For instance, your winning version might have performed well as per your primary metric- Click-Through Rate (CTR), but instead cost you your revenue or Average Order Value (AOV).
With a secondary metrics analysis, you get a more balanced picture of your winning version’s performance.
Uncover interesting insights
Digging deeper into your AB test results with secondary metrics can help you get other interesting insights that might not be apparent on the face of the results. For instance, let’s say your AB testing results find that for the winning version, the purchase per user fell, but the AOV rose.
This could mean that your winning variation prompted users to purchase less in quantity but purchase more expensive products, driving revenue. Something you wouldn’t happen upon if you didn’t undertake secondary metric analysis.
Pro tip: Analyze your Uplift and Probability To Be Best scores for each secondary metric to understand how each version performed. This will tell you whether you can serve all your traffic with the winner version or instead tweak your allocation depending on what you’ve uncovered.
3.Audience Breakdown Analysis
The final analysis that helps you truly wring every last drop of value out of your AB testing results involves segmenting your audience by behavior, demographics, or any other relevant factors. Doing this allows you to answer questions such as:
How did the traffic source affect the test results?
Which version won for desktop, and which one won for mobile?
What version works best for new users?
Now, while it can be tempting to segment your audience mercilessly to drive personalization, keep the following in mind during segmentation:
Keep segments large enough to ensure statistically significant results
Keep segments relevant to your business goals
Keep segments actionable in terms of personalization efforts or any other future strategy
Again, for every audience, analyze the Uplift and Probability To Be Best metric scores to ascertain how every version performed. This will help you determine whether you should serve the winning version to all your traffic or tweak it based on your learnings.
Make your way through the A/B test results according to the above and you can rest assured that you’re getting the most out of your AB testing results.
But wait, there’s more.
At the beginning of this section, we’ve presumed that your AB testing results have found a winner. But what if your test doesn’t come with a winner? What happens then?
Is the test redundant? Does all hell break loose?
No, and no. You see, as personalization takes center stage with customer engagement and conversions, tests and experimentations that don’t consider the distinct individual audience conditions often conclude with no winner, with statistical significance becoming difficult to achieve.
In other words, the usual one-to-many testing approach will not work for all visitors anymore. There will always be a portion of your audience that your winning version will not address.
Once you understand this significant drawback of AB testing, you come to the conclusion- that AB tests with no winners might actually have winners, too.
Let’s take an example to understand this better.
In the following AB test that ran for 30 days, the AB testing results reported the control version outperforming the challenger version.
With this, you’ll naturally believe the challenger version is just sub-par. But break the test down by devices, and you uncover a completely different picture.
Breaking the test down by user devices, the controller version wins on desktop, but the challenger version outperforms it on tablet and mobile.
This example is meant to underscore the importance of dissecting your A/B test results. Only once you’ve analyzed your AB results can you confidently move to implement the conclusion of the test.
But what if we told you, you could make all this easier and quicker? All you need is a tool like Fibr AI. With a powerful reporting and analytics feature that gives you an in-depth analysis of your campaign performance, Fibr AI helps you get instant insight into which variation is your top performer. As a result, fueling quicker optimization, informed decision making and overall campaign efficiency.
Why Is Understanding AB Test Results Important?
Understanding A/B test results isn’t just about knowing which version performed better—it’s about uncovering why it worked and how those insights can shape your strategy. By interpreting results accurately, you can make data-driven decisions, avoid costly missteps, and continuously optimize for success.
Let’s explore why digging into these results is crucial for building smarter, more impactful campaigns:
1.Ascertain the Effectiveness of Changes
Analyzing, interpreting, and digging deeper into your AB testing results can help you understand whether the changes you made have the intended effect on your desired metric. These changes can include Calls to Action (CTAs), headlines, content, or even buttons on your landing page.
2.Identify Your Top Performing Variation
Examining and comparing test performances of the different variations can help you recognize the changes that help you drive your KPIs and metrics, such as CTRs, conversion rates, etc.
3.Understand The ‘why’ Behind The A/B Results
Interpreting your A/B results helps you understand the reason why specific variations perform better or worse. This, in turn, helps you deploy better tests and make more informed optimization decisions.
4.Make Data-Driven Decisions
With AB test results, you get a deeper understanding of your customers’ behavior—giving you an invaluable resource to help make a wide range of decisions, even those that aren’t directly related to the A/B tests.
Further, by diving deeper into your AB test results, you can make sound decisions about whether to keep testing, change its direction, or implement the change.
Components To Look at When Interpreting AB Test Results
When analyzing the results of an A/B test, it's essential to evaluate several factors to draw meaningful insights. Here are some key considerations to ensure your conclusions are accurate and actionable:
1.Size of the AB Test Sample
The size of your sample plays a critical role in the reliability of your A/B test. Small samples often lead to inconclusive findings, while excessively large samples can amplify minor variations, making them appear statistically significant. To achieve dependable results, ensure your sample size aligns with the scale of your test and audience.
2.Duration of the A/B Test
The age-long question- How long should I run A/B tests? has no satisfactory answer. Deciding the ideal test duration depends on factors like traffic patterns, audience behavior, and the nature of the test.
Typically, tests should run for at least one or two weeks to capture variations over different days or times. Moreover, statistical significance can guide the decision to end a test. For instance, reaching a 99% confidence level is a strong indicator that your results are trustworthy.
3.Conversion Rates
Tracking conversion rates is a cornerstone of A/B testing, but these metrics must be analyzed in context. Variations in traffic volume can influence conversion rates significantly. A page with high traffic may achieve a better conversion rate compared to one with lower traffic. Neglecting this context can result in misinterpretations of your results.
4.Contextual Factors
External factors, like seasonal trends or competitor activity, and internal factors, such as ongoing promotions or page updates, can impact test results. For example, running an A/B test during a holiday sale might yield inflated traffic and conversions. Without accounting for these variables, your findings may not hold relevance for periods outside of the test window.
5.Statistical Significance
The significance level, often measured by the p-value, helps confirm whether the observed differences between test variations are genuine or due to chance. A commonly accepted p-value threshold is 0.05. If your p-value falls below this, you can confidently reject the null hypothesis, concluding that the differences observed are meaningful.
Level Up with Fibr AI
We reckon you might have realized by now that….A/B testing? Not exactly possible manually, given the sheer number of landing pages and elements in the mix today. The test is powerful and a core need for businesses looking to stay relevant and ahead in the increasingly competitive world. And so, it's important to ensure your A/B testing efforts are nothing short of flawless.
How do you achieve that? Glad you asked. With Fibr AI. Personalize your landing pages for every communication, campaign, and audience with the power of AI. And leverage our powerful AI A/B test testing tool to create, run, and analyze A/B tests on any website.
Ready to level up your online presence? Book a demo today!
FAQs
1. What are A/B tests used for?
A/B tests are used to determine which of the two versions of the same element performs better and drives business goals. It can be applied to headlines, contextual content on your website, email subject lines, page layout, and more.
2.What does the confidence level of an A/B test indicate?
The confidence level of an A/B test tells us how probable it is that the test results are accurate and not due to a random chance. For example, a 78% confidence level indicates that there is a 78% chance that the observed difference in the A/B test results is accurate and aligned with reality, and not due to a random chance.
3.How do I choose my A/B test Metrics?
Your A/B test metrics depend on your unique test goals. That said, some of the most common test metrics include click-through rate (CTR), conversion rate, revenue per visitor, and time on page.
4.What does an A/B test result not being statistically significant mean?
If an AB result is not statistically significant, it means that there is a lack of evidence to support whether the differences observed between the two versions of the element are real. In other words, we cannot confidently conclude that one version is, in fact, better than the other.
Meenal Chirana
Content Marketing Manager
Meenal Chirana, Content Marketer at Fibr, brings five years of experience in the content field to the team. Her passion for creating engaging content is matched only by her expertise in writing, SEO and content marketing . Passionate about all things content and digital marketing, she is always on the lookout for innovative ways to connect with audiences and elevate brands.